I use Metricbeat to monitor an Elasticsearch node and send metrics to it.
The versions of all components are 8.5.3
The Metricbeat configuration file is as follows
## Metricbeat configuration
metricbeat.config:
  modules:
    path: ${path.config}/modules.d/*.yml
    # Reload module configs as they change:
    reload.enabled: false

metricbeat.autodiscover:
  providers:
    - type: docker
      hints.enabled: true

metricbeat.modules:
  - module: elasticsearch
    hosts: [ http://elasticsearch:9200 ]
    username: username
    password: password
    xpack.enabled: true
    period: 30s
    enabled: true
  - module: logstash
    hosts: [ http://logstash:9600 ]
    xpack.enabled: true
    period: 10s
    enabled: true
  - module: kibana
    hosts: [ http://kibana:5601 ]
    username: username
    password: password
    xpack.enabled: true
    period: 30s
    enabled: true
  - module: beat
    period: 10s
    hosts: ["filebeat:5067", "localhost:5066"]
    xpack.enabled: true
setup.template.settings:
  index.number_of_shards: 1
  index.number_of_replicas: 0
output.elasticsearch:
  hosts: ['http://elasticsearch:9200']
  username: username
  password: password
http.enabled: true
http.host: 0.0.0.0
logging.metrics.enabled: false
But I found that in the Stack Monitoring > Elasticsearch > Overview panel> Latency has no data.
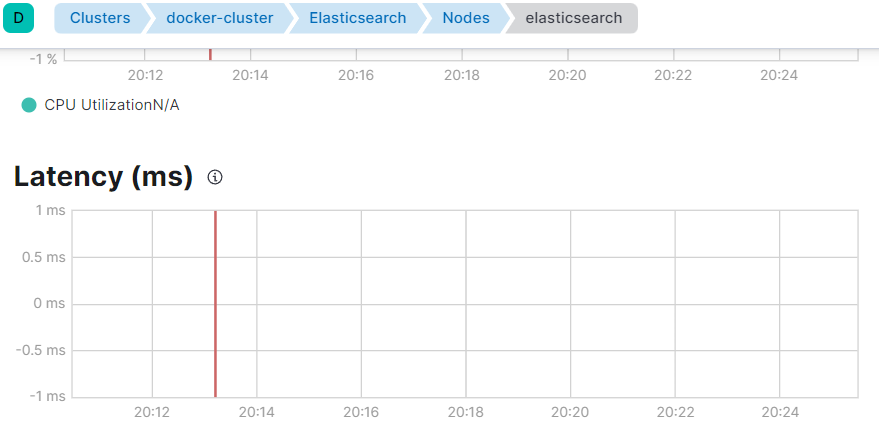
How can I display it?