We have a issue with the limit of JVM heap. Our Elasticsearch data nodes have a data, ingest and master role, and the node that allow it have 32gb of memory and 8 cpu. Our configuration of resources on data nodes:
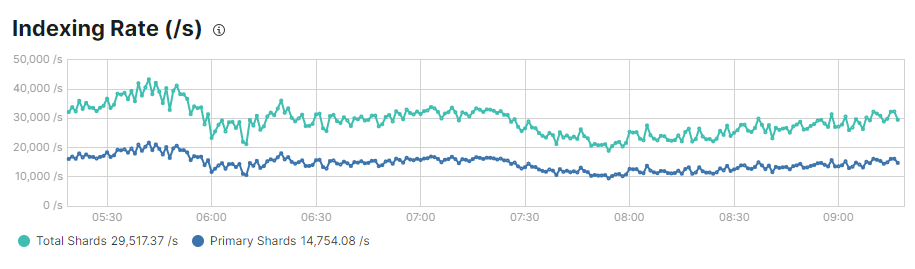
Seem like the memory is not allowed to use all memmory limit. Problem is that the ingest is below of desired ingest, and before of upgrade resources we need to chek if this valor is correct.
It looks like you have enough heap assigned. Generally it is disk I/O, CPU or network throughput that limits indexing throughput rather than heap (unless you have issues with GC). Data, mappings and the number of shards indexed into can also play a part.
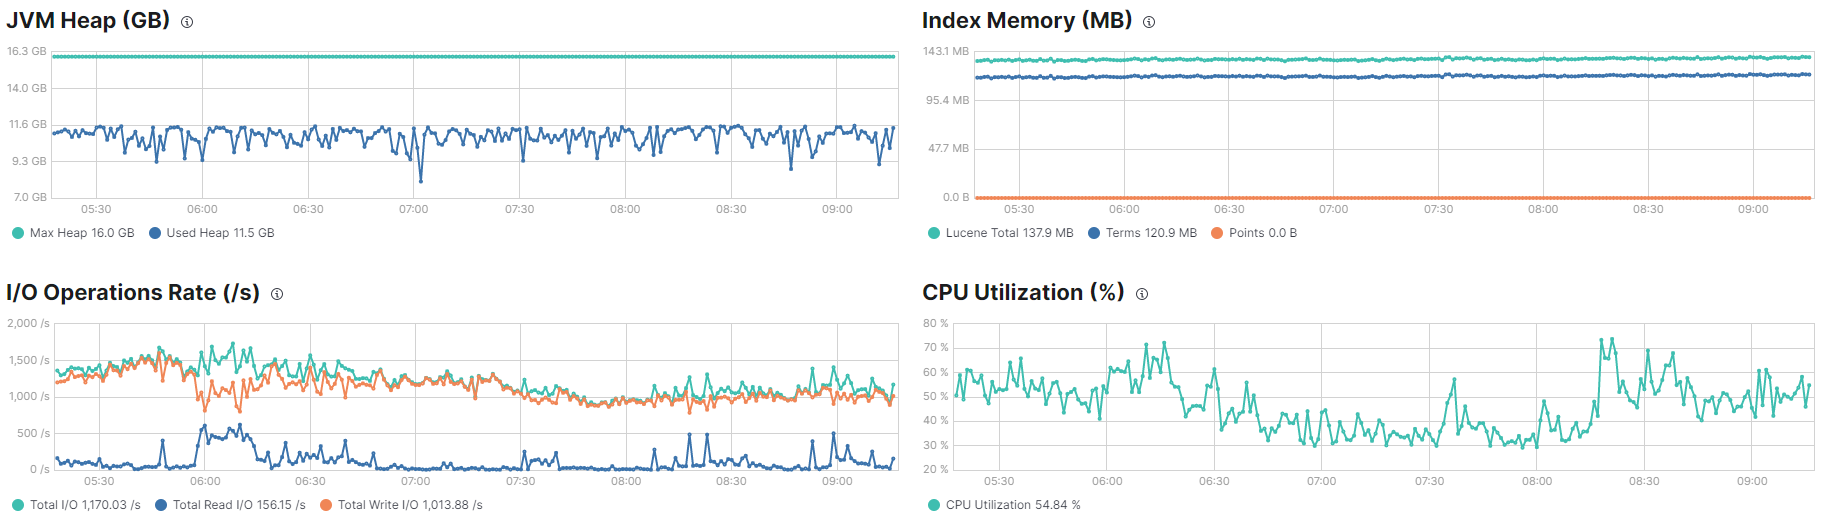
We need to allow more ingest rate but seem like the memory it's limiting to improve it. Is not a memory issue? There are 4 GB unused into every node. We spend aws ami with 32gb to configure every data node with 16 and the monitoring use only 1/3 of total node memory. (4x9 nodes = 36gb unused!)
Memory and heap usage looks fine and is not what is limiting indexing throughput. If heap usage gets too high it is rather likely to reduce indexing throughput rather than increase it.
What instance types are you using? What type of storage are you using? What does disk I/O and iowait look like on the nodes?
Talking with a mate, we conclude that should be a problem with the config? If kubernetes node have 32 gb of memory, we deploy Elasticsearch with a resource request 16gb and limit 32 gb, and Elasticsearch recomend configure JVM with 50% of Elasticsearch memory, not node memory. This apply into request and not to limit?
That means that we need to scale nodes to 64gb, to configure ES request 32 and limit 64, jvm into 32 to allow around 16-20 GB of JVM heap?
It seems like current ES memory conf is not thinking in kubernetes scenario. Some idea to improve this memory resource?
Elasticsearch uses off-heap memory as well as the operating system file cache, which is what 50% of available RAM is allocated to. I would recommend making the request 32GB if you have a 16GB heap.
If your heap is sufficiently large for the processing of your cluster (which it seems to be based on your graphs) increasing the heap and memory is unlikely to improve indexing throughput. Based on the iostat data you provided I would suspect it is more likely that your storage is the bottleneck.
How are you indexing into Elasticsearch? What does your pipeline look like? What size bulk requests are you using? How many different indices and shards are you actively indexing into?
How did you determine that it is Elasticsearch that is the limiting factor and not some step in your indexing process?
We use logstash to indexing into Elasticsearch. The pipeline seem loke well, no delay into steps. Our index buffer size is 20% and min indez buffer size 96mb. There are along of 500 differents index by day and 1 replica shard by index.
We determine that memory is limiting because when testing configure more requested memory (28 instead 16) the JVM heap show improves, but is not running with all 16 gb conf:
Node request 16gb, limit 32gb (same as total of node), JVM at 16gb
If you see, the first image is around 9-10gb and the second between 10-11. That show that if we have more memory into node and into Elasticsearch pod, the ingest improve because use more memory to do it.
The problem is, node with 32 gb, ES with 50% of memory of the node requestered only use around 10 gb of JVM to index and seem like the indexing rate stopping here.
I have seen many systems that did not achieve the desired indexing throughput and where there was no obvious limiting resource in Elasticsearch. Unless the heap was too small and resulted in frequent or long GC this has never been the limiting factor.
Based on what you have said so far I suspect either your sharding strategy or Logstash configuration may be the issue, so I would recommend diving into this further.
How many Logstash instances do you have?
Are the 9 pipelines you have running on separate Logstash instances or do they share inputs?
Can you please answer the following for each of the 9 pipelines you have in place:
What inputs do data come from? Are any of these shared with other pipelines?
Are you using any potentially expensive filters that might be slow, e.g. enrichment based on Elasticsearch queries, JDBC etc?
How many pipeline workers have you got configured?
What is the batch size?
How many different Elasticsearch outputs do you have configured? How many indices and shards does each of these potentially write to?
Yes, we use 9 multiple pipelines. Our version of eck is 1.8 and our ES, kibana and apm version is 7.16.2. The logstash batch size is configure in 500 and use 1 pipeline worker. Number of threads change between logstash, tehere're multiple logstash (by solution).
This configuration result of multiple test with logstash conf, and seem like is the best to our ES.
If you have pipeline workers set to one for a pipeline that means only a single thread is used for processing, which could be limiting throughput.
When writing to Elasticsearch using bulk requests you want groups of documents (as many as possible) to go to the same shard as this improves indexing throughput. Be aware that the bulk size Logstash uses is the unit of work that is handled together in a pipeline.
If you have multiple Elasticsearch outputs in a pipeline only the documents within the batch that match the criteria will be sent to Elasticsearch, so the maximum bulk size is the batch size. If there are many conditional Elasticsearch outputs, this can lead to a lot of small bulk requests being sent, which is inefficient. It is also worth noting that these are sent sequentially within a pipeline, which will increase the processing time of a batch and reduce throughput unless you have many pipeline workers. I would therefore recommend grouping data by pipeline and have as few different Elsticsearch outputs as possible in order to ensure large bulk sizes. You may also want to increase the bulk size, although that will lead to increased Logstash memory usage.
Within a single Elasticsearch output it is possible to dynamically set the index name and have a single bulk request write to many indices/shards. Using this approach can reduce the number of Elasticsearch outputs and the number of requests made to Elasticsearch, but may still be causing problems. As mentioned earlier you want a bulk request to index into as few indices/shards as possible as this makes indexinbg much more efficient in Elasticsearch. IF you are indexing into hundreds of daily indices it is likely that a bulk request may contain only a very small number of documents per shard, which will result in significant overhead in Elasticsearch, effectively negating some of the benefits from using bulk requests. This is where your sharding strategy plays a part. Indexing into a lot of small indices/shards is very inefficient and will limit throughput.
Apache, Apache Lucene, Apache Hadoop, Hadoop, HDFS and the yellow elephant
logo are trademarks of the
Apache Software Foundation
in the United States and/or other countries.