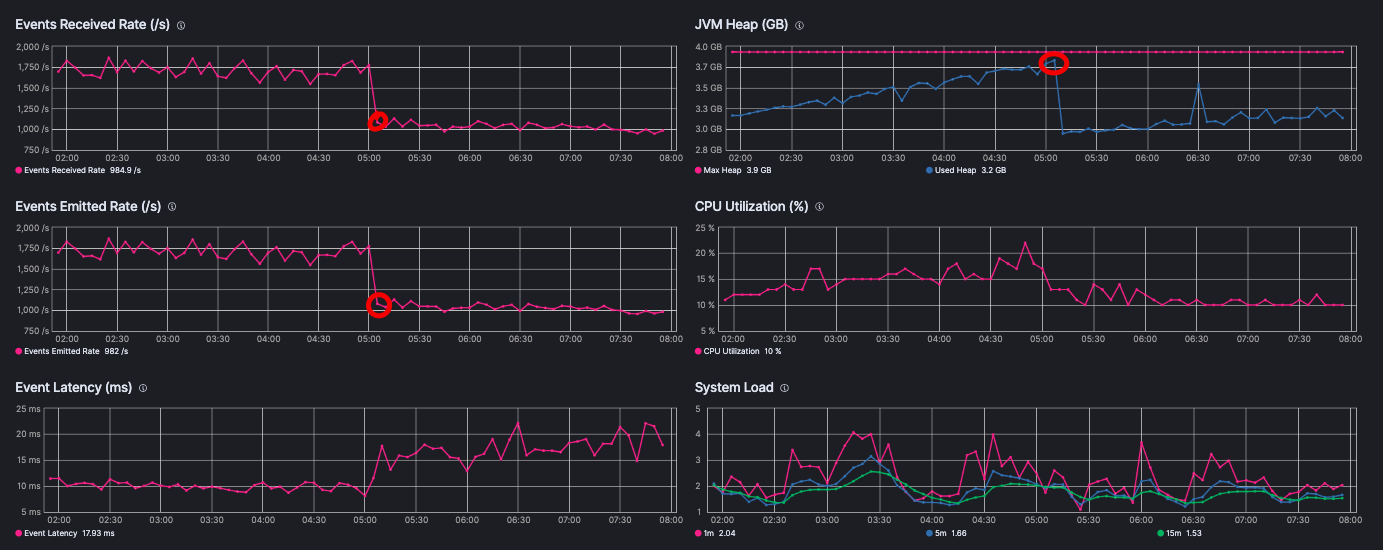
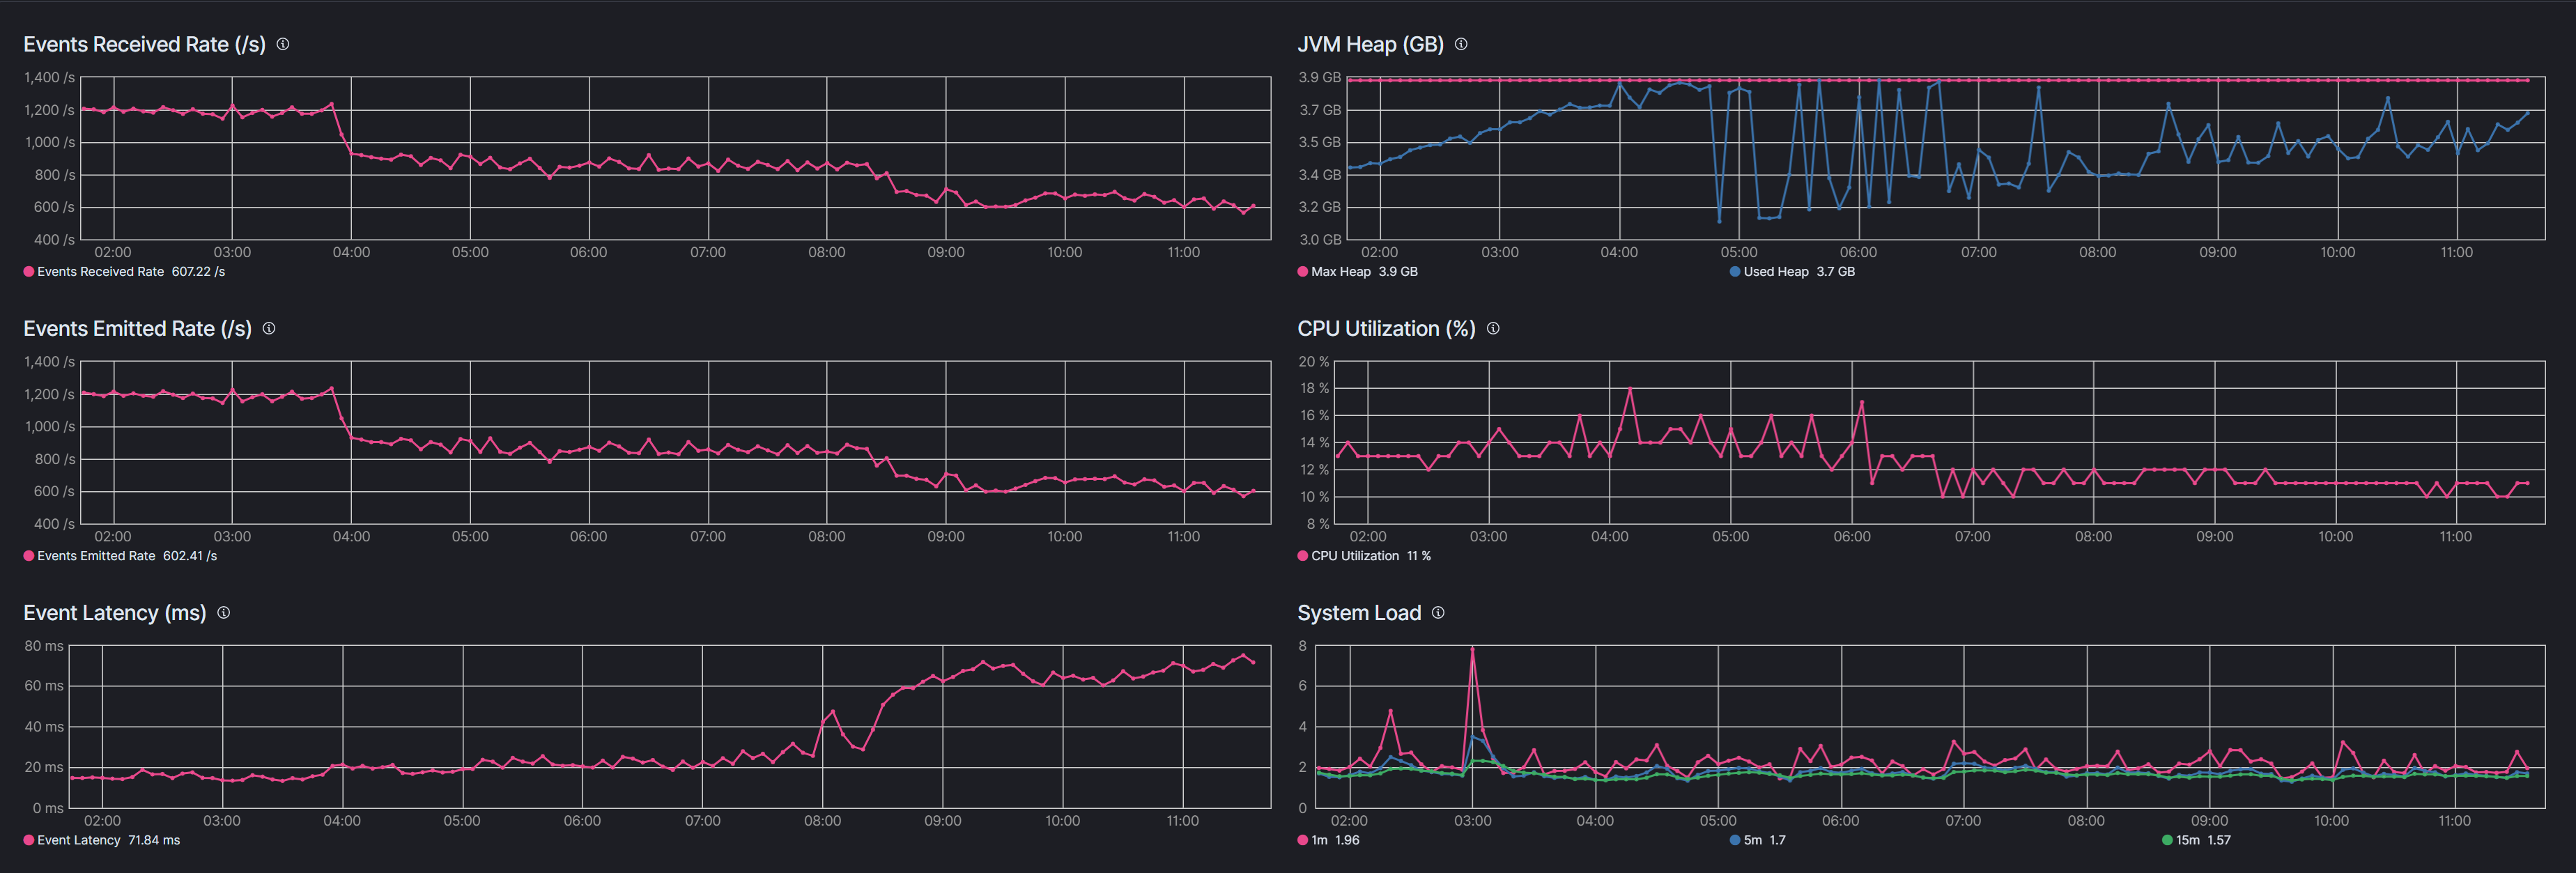
I have a logstash performance degradation problem. It happens when jvm heap memory size is near its upper level. Events received/emitted rate drops sharply and latency increases dramatically. Only after service restart - all indicators returns to normal.
That's hard to explain. With -XX:CMSInitiatingOccupancyFraction=75 and heuristics disabled using UseCMSInitiatingOccupancyOnly CMS sweeps should be kicking in as soon as heap usage crosses 3 GB. Normally that would, in fact, limit heap usage to around 3 GB, meaning you never get to use 25% of the heap. That's why Sun gradually increased the default occupancy trigger threshold from the original ridiculous default (something like 66%) up to, I think, 96%.
Your heap usage is very close to reaching 100% before it drops down, which suggests to me CMS is not freeing stuff, and a Full GC is triggered. At the full GC the JVM may have freed up weak references that are used for cached items, which could conceivably impact performance, but I would not expect that impact to persist. Anyways, to improve CMS's performance it is possible you would need CMSPermGenSweepingEnabled and CMSClassUnloadingEnabled, but we need GC logs to confirm it.
to the jvm.options, restart logstash and run with that logging enabled until the performance degrades, then post the log somewhere so that we can look at it?
Apache, Apache Lucene, Apache Hadoop, Hadoop, HDFS and the yellow elephant
logo are trademarks of the
Apache Software Foundation
in the United States and/or other countries.