Hi,
We are using logstash version: 7.6.1, from the helm chart - https://github.com/elastic/helm-charts/tree/master/logstash.
resources:
  requests:
    cpu: "2"
    memory: "6Gi"
  limits:
    cpu: "2"
    memory: "6Gi"
logstashJavaOpts: "-Xmx3g -Xms3g"
logstashPersistenceStorage: 6Gi
logstashReplicaCount: 2
logstash config:
  logstash.yml: |
      http.host: 0.0.0.0
      config.reload.automatic: "true"
      queue.type: persisted
      queue.checkpoint.acks: 0
      queue.checkpoint.writes: 0
      queue.checkpoint.interval: 0
      queue.drain: "true"
      queue.max_bytes: 3gb  # disk capacity must be greater than the value of `queue.max_bytes`
      pipeline.workers: 4
      pipeline.batch.size: 5000
      #pipeline.batch.delay: 50
      # X-Pack
      http.host: "0.0.0.0"
      xpack.monitoring.enabled: true
kubernetes logstash service is behind an AWS internal ELB, for some reason all the requests to logstash go to only on logstash pod and the second pod is mostly idle.
here's the ELB configuration:
service:
  annotations:
    external-dns.alpha.kubernetes.io/hostname: logstash.{{ .Environment.Values.dnsZoneName }}
    service.beta.kubernetes.io/aws-load-balancer-internal: "true"
    service.beta.kubernetes.io/aws-load-balancer-extra-security-groups: {{ .Environment.Values.logstashSecurityGroup }}
  type: LoadBalancer
  ports:
    - name: beats
      port: 5044
      protocol: TCP
      targetPort: 5044
    - name: http
      port: 8080
      protocol: TCP
      targetPort: 8080
This happens in all environments
here is a screenshot of CPU:

As you can see the blue line is for
logstash-0 and purple is for logstash-1 pod, at any given point of time only ONE POD IS USED. This doesn't happen with any other services, we use the same networking for kibana but there are no load-balancing issues there.
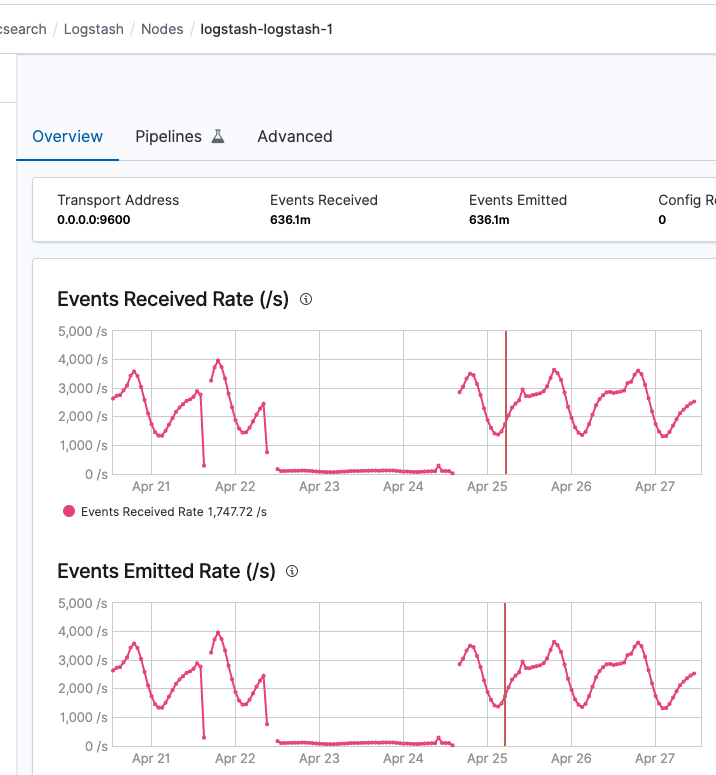
Events rate screenshots:
logstash-0:

logstash-1:
One more question:
we give 6GB of RAM for logstash pods, how much of that can be allotted for HEAP space, right now we set it to 3GB of heap space, is that appropriate or do we need to adjust it?
Based on what values should we adjust the heap space?
here's a heap space graph for the pod which is used most of the time:
