Nowadays I have CPU problem and I am trying fix it.
I saw a person in the forum talk about change RateLimitBurst parameter into /etc/systemd/journald.conf.
I have changed this parameter for 0(unlimited) and realy my problem about this message and CPU overload resolved. However I saw that my logs ingest decrease 50%.
How I reach a mixed of ingest logs and rate limit burst? Is there a best practices?
P.S: I have a endpoint wich send 100000 messages each 30 seconds. When I stop this pipeline in logstash my CPU normalize.
It looks like that the logstash.service is generating a lot of logs, which is not common unless something is not working right.
Do you have debug log enabled? Are you getting errors in logstash log file?
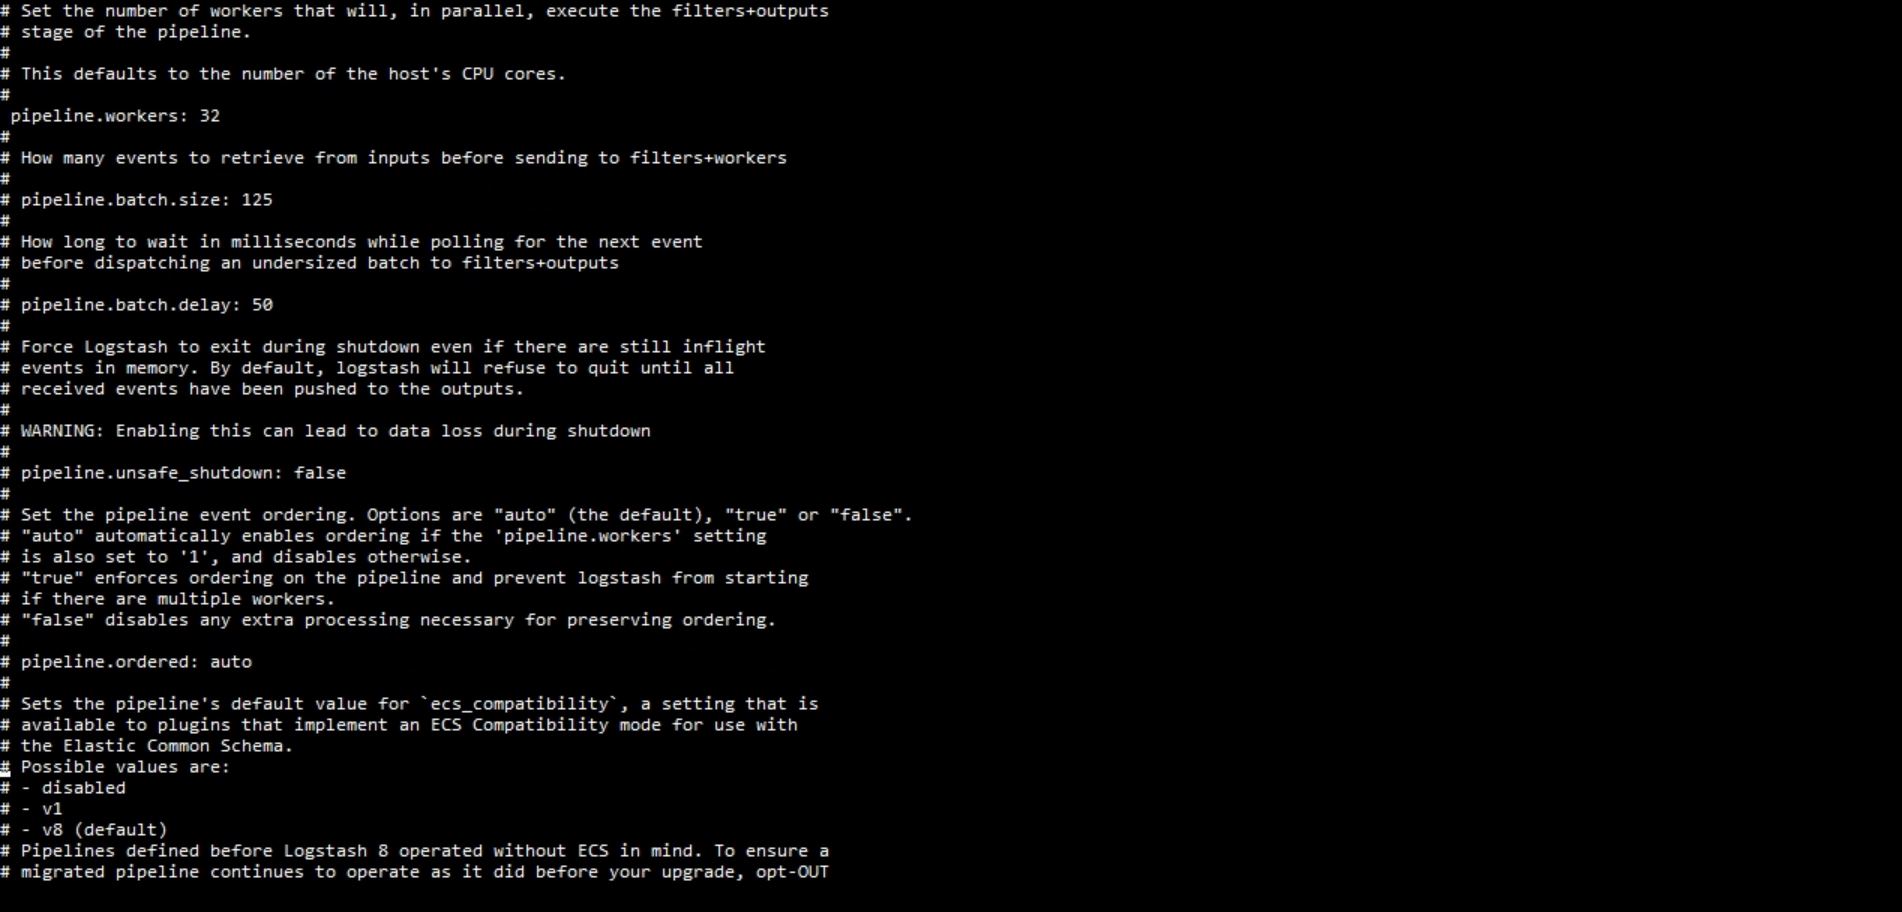
Also, any reason to give 64 GB of HEAP to Logstash? This seems to be too much memory for just logstash, tipically you would not need to even give more than 8 GB.
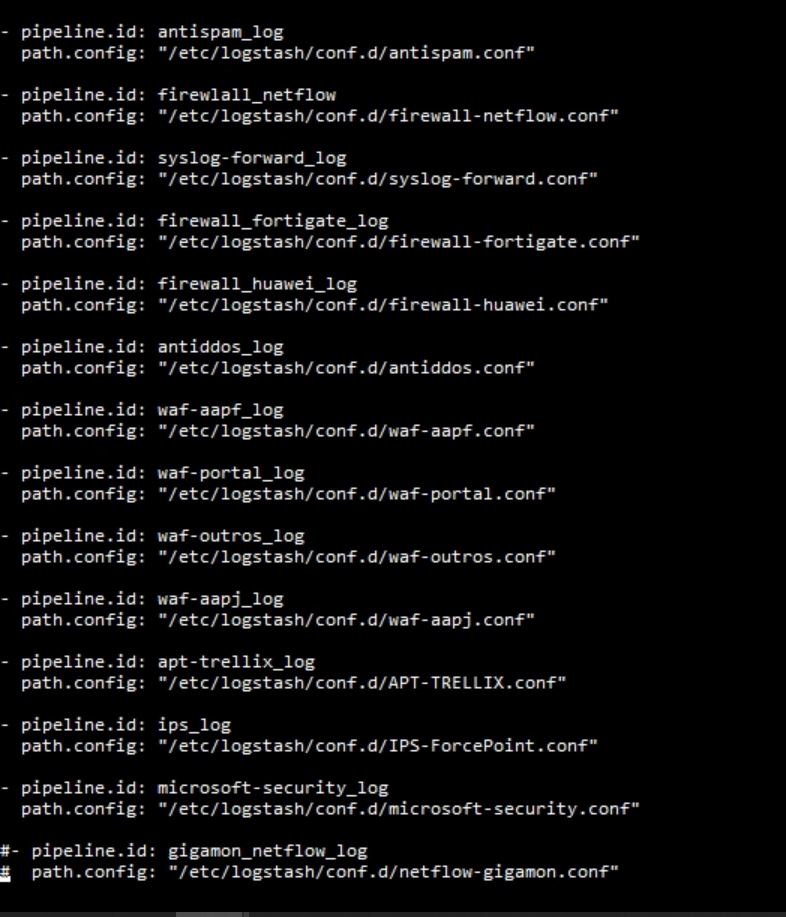
Can you share your logstash.yml, pipelines.yml file and logstash logs if you have WARN or ERROR lines?
I mean, if you have debug log level enabled in logstash.
This is expected, if your host is having performance issue, it may impact the connections, and UDP logs will be lost, depending on the source the tcp connections could be retried by the source.
Please share those pipelines as plain text, not as screenshots.
As I mentioned, if one of your pipelines has some errors, like some grok filter that is not working right, this could generate a lot of log errors and increase the load.
Grok can be resource intensive and can lead to high cpu usage if you have a lot of messages that does not match your grok.
This could be your issue since you said that disabling this pipeline it will decrease the CPU usage.
Personally I avoid using grok unless there is no alternative, you can try to improve your grok with some small changes, I recommend that you read this blog post.
For example, your grok is not anchored, the first thing I would do is to anchor it, just add a ^ in the start of your patterns, something like this:
'^<%{NUMBER:Event_type}>REST OF YOUR PATTERN
Also, it seems that your message is a CEF message, so it may be easier to use the cef codec in your input instead of the grok filter.
there is also KV plugin for key=value for instance usrName=something, however you need to a partially parse before with grok or dissect something like:
Apache, Apache Lucene, Apache Hadoop, Hadoop, HDFS and the yellow elephant
logo are trademarks of the
Apache Software Foundation
in the United States and/or other countries.