The workers setting in the UDP input is not the same thing as pipeline.workers.
The pipeline.workers can be set in logstash.yml, which will apply to every pipeline, or per pipeline in the pipeline configuration in the file pipelines.yml.
If you didn't made any change to this setting before it will default to the number of CPU cores in the logstash machine, for example, if your logstash machine has 8 cores, then the pipeline.workers is already set to 8.
It seems you have a heavy traffic load. How will decreased pipeline.workers to min help to process more with less resources? The pipeline.batch.size might be interesting for the optimization. Check the topic.
I have isolated logs from this endpoint at a server with only 20 Vcpus and 32M memory.
After I started collecting logs, there was no delay in the date and time. However, the delay started again this morning.
This morning, I received many alerts about URLs being marked as dead and Elasticsearch being unreachable.
After receiving these alerts, the logs started to insert with delay.
I noticed a message in /etc/log/journal stating: "server begins to drop messages due to rate limiting." So, I set up rate limiting in /etc/systemd/journal.cfg.
This endpoint sent average 6MM of logs for 15 minutes.
It is not clear what you are referring here, what is this endpoint? It is something sending logs to Logstash using TCP?
Also, not clear where this is from, what is the log? Is it from Logstash or anything else? Please share the logstash logs, look at /var/log/logstash/logstash-plain.log.
This message just tells that the journald is limiting the logs, but it is not clear from wich application is it limiting nor what is the log.
6 MIllion events per 15 minutes is something close to 7k events per second, it is a considerable rate, but it is not possible to know where is your issue without more context.
Please provide more context like what is your source, what your logstash pipeline looks like, what is your output, if you are using persistent queues or not in Logstash etc.
Increase the number of shards. Currently, I have only one shard and one replica. I believe increasing it to four shards and one replica would be beneficial since I observed spikes of logs.
These logs shows that your Elasticsearch cluster is having some issues, there are multiple logs about No Available connections, which means that Logstash is not able to send logs to Elasticsearch.
If Logstash cannot send logs to Elasticsearch it may stop receiving logs, which can lead to gaps or delay in some cases.
What are the specs of your Elasticsearch nodes? Is your disk SSD or HDD?
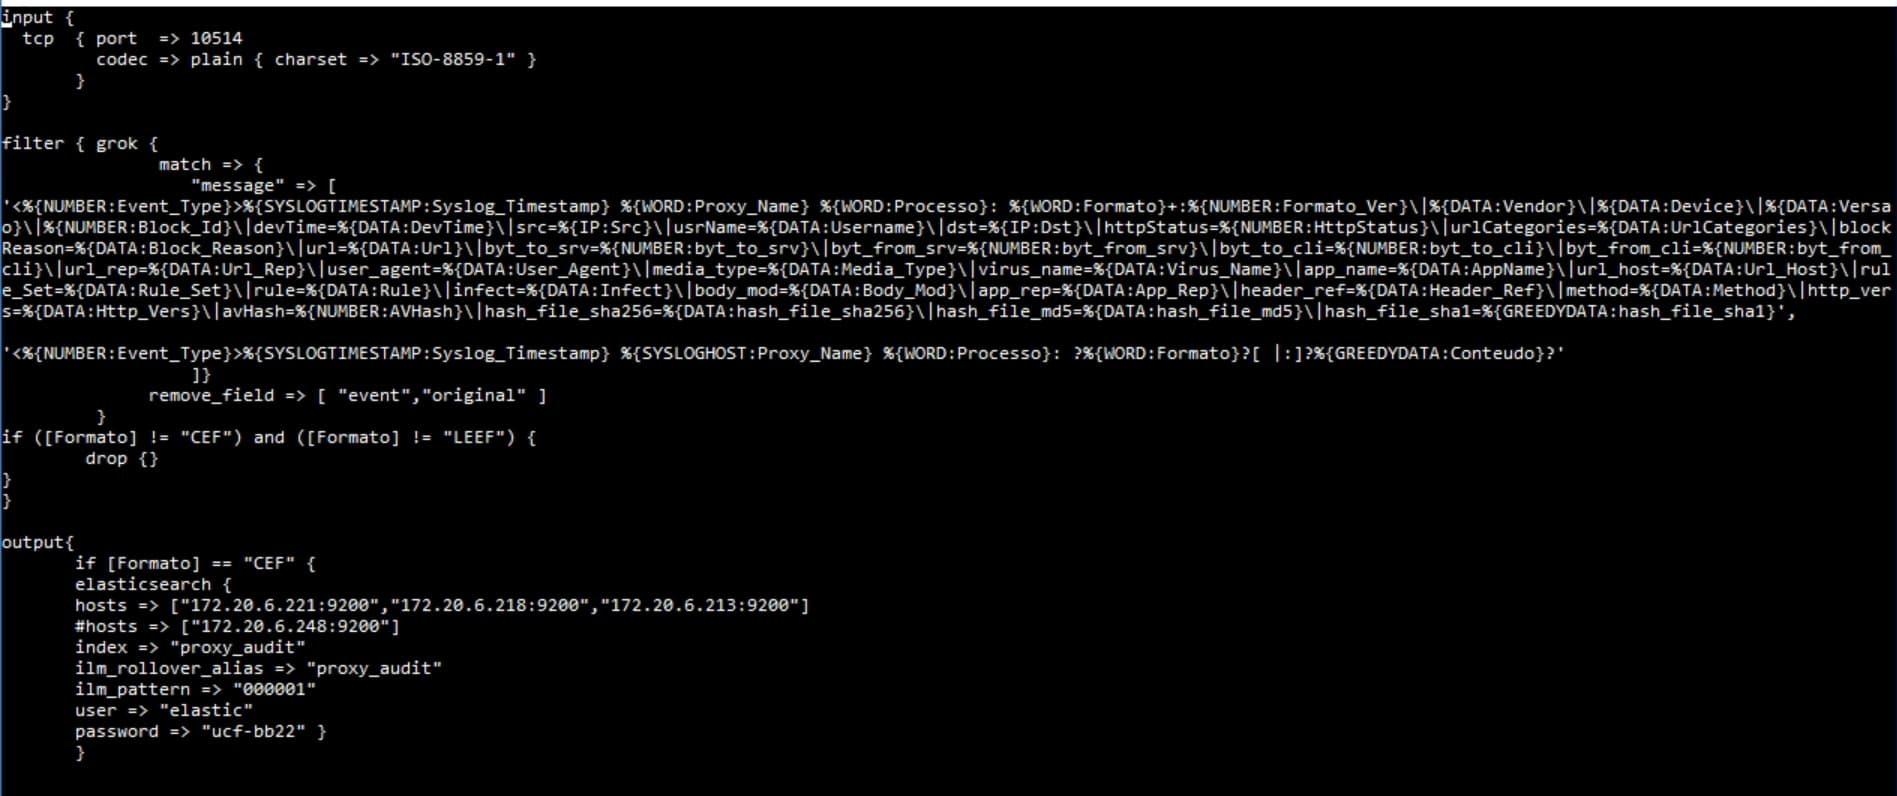
Your log seems to be a combination of a plain text message and some kv message, you can combine dissect and kv to parse this, I don't see any need to use grok in this case. Can you share a plain text sample of your log, not a screenshot?
How many nodes do you have?
Not sure this is needed, as mentioned your log shows that Logstash is having some issues to connect to Elasticsearch, which could indicate some issue in the Elasticsearch cluster.
I would also check the performance of your Elasticsearch cluster.
I have set the pipeline.batch.size to 5000 and now I no longer observe any delays.
I am not entirely certain, but I believe that now logs are remaining in the Logstash queue before being sent to Elasticsearch. This appears to have helped reduce the delay.
Regarding the Elasticsearch error:
I noticed many errors in /var/log/elasticsearch related to threshold limits. Could this be related to the type of hard disk and its performance?
Did you check your Elasticsearch performance? Some things you shared indicates that you may have a performance in Elasticsearch side.
As mentioned you need to check your Elasticsearch performance as well, this will also impact your Logstash performance since it is your output.
Also, the pipeline.batch.size in logstash defines the maximum number of events each individual thread will collect before executing the filters and outputs, 500k seems way, way too much since you are also using 16 workers. How did you arrive at this number? I would not recommend to just increasing it as this can make everything worse and harder to troubleshoot and find the real bottleneck.
9 million events each 5 minutes is around 30k e/s, which is a considerable event rate.
Just as an example, I had in the past a 100k e/s cluster and the biggest pipeline.batch.size used was 1k.
From the Elasticsearch logs you share it seems that you may have issues in your Elasticsearch cluster.
What is your Elasticsearch specs? Are you using SSD or HDD? What your mappings looks like? What is the refresh interval for your indices? There are many, many things that could impact Elasticsearch performance, in this post about how to tune for index speed you have some examples and how to improve it.
From what you shared it doesn't seem that your issue is in Logstash, but in Elasticsearch.
Can you provide more context about your Elasticsearch cluster?
Like, number of nodes, specs of the nodes, disk type (hdd or ssd or nvme), operating system type, if linux what is the filesystem and mount options etc
Delay start with few seconds, but after sometime this increase.
I setuped in /etc/logstash/pipelines.yml pipeline.batch.size equal 50k, and for some time it worked well. However a few days this solution doesn't work more.
I perceveid that when process is low delay not happening or was so little.
About Elasticsearh environment:
I have 3 nodes in cluster with this specification:
32 Vcpus
10TB storage
126G
But I saw this week that jvm.options is only 4g in elasticsearch:
Each node has 126 G? If I'm not wrong if you didn't change the value of Xms and Xmx in the jvm.options, then Elastic will use half of the ram, which would around 63 GB .
There is a recommendation to not use more than 30 GB of heap.
If the values are commented on jvm.options, you are not using 4 GB, but probably 63 GB, I would recommend you to change this to a maxium of 30 GB for both Xms and Xmx.
Also, what is the disk type? You didn't specify is 10 TB SSD or HDD? HDD is pretty bad, specially if you have a high event rate.
Your elasticsearch nodes have a lot of resources, but you didn't answer yet what is the disk type.
Is it SSD or HDD? This makes a huge difference in performance.
Also, you can disable swap, it is recommended to not have swap enable on servers running Elasticsearch, I don't think this will mak a huge difference since you have plenty of memory, but it is a recommendation.
What kind of filesystem are you using in your Linux? XFS? EXT4? If it is ext4 there are some mount options that you can check to improve the disk performance.
Is it RAID? It showing as rotational disks for the SO (ROTA 1), not sure why, but I know that in some cases RAID can be identified as rotational disks, not SSD.
Not sure if this will impact much in the performance or not.
I have no idea what could be the root cause of this delays that you mention, the only thing I could think was some performance issue in your Elasticsearch cluster, but nothing you shared helped much.
This is pretty hard to troubleshoot without a lot more of evidence and as mentioned before, increasing things up will not solve anything until the root cause is found.
Your specs are pretty powerful, 32 cores + 10 TB ssd + 30 GB of heap should have no issues with the event rate you specified.
6 million events each 15 minutes is something around 7k e/s, this should be no issue for specs like that.
I have a 4 node cluster with 4 hot nodes with 64 GB (30 GB Heap), 16 vCPU and 4 TB SSD and I'm doing 55k e/s without any issues.
Try to get the performance of the node when the delay is happening, like CPU and more important IO stats, uses iotop and iostat to check it.
Another important thing, the monitoring screenshot you shared, where is the monitoring data being sent? To the same cluster or to monitoring cluster?
Apache, Apache Lucene, Apache Hadoop, Hadoop, HDFS and the yellow elephant
logo are trademarks of the
Apache Software Foundation
in the United States and/or other countries.