Hello Elasticseach community! ![]()
Writing speed on SSD is low and I am not sure where the bottleneck is.
- I use Elasticsearch 7.14.0 in Kubernetes
- 4 data nodes
- 3 masters
- 8G RAM 4g heap 1 CPU each
- 512 Standart SSD each.
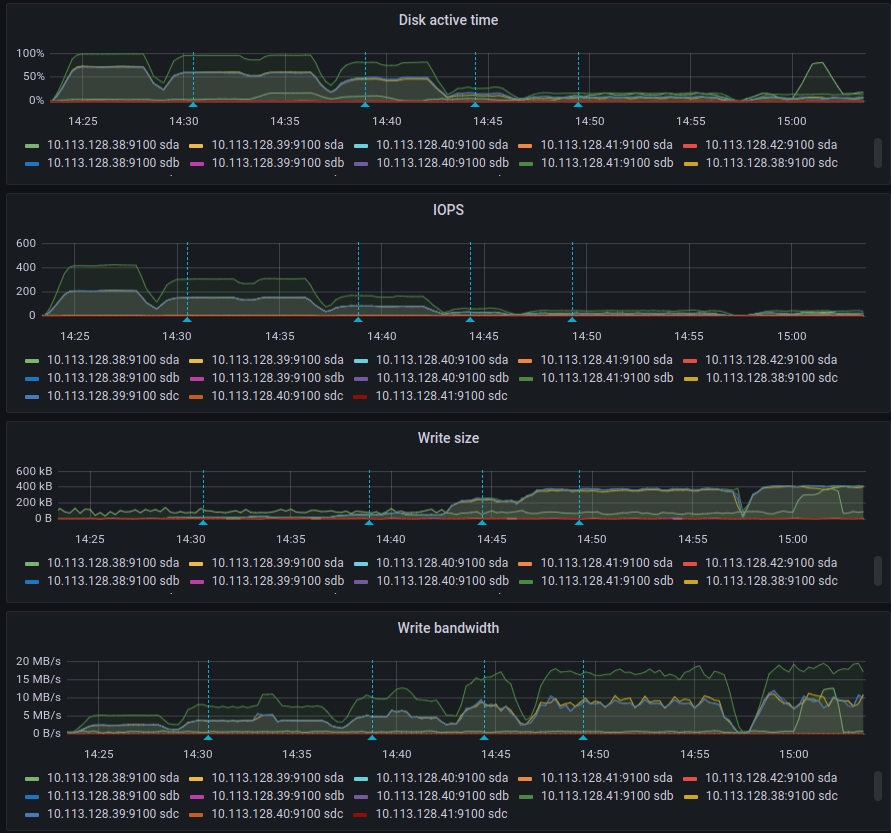
I did esrally event data tests with various bulk sizes (see blue annotations), the maximum write speed per node was 20MB/s, and max 30K docs/s in total, CPU is very low and memory is used normally. I have the feeling that there is a big bottleneck somewhere because disk in not saturated (or do you think the opposite I am not sure about that)
Index rate (in stack) 4 nodes contribute to 30k logs/s:

Disk metrics are better with higher bulk size:
I think low block size + fsync might affect the writing speed on SSD disks a lot, it may be the reason for slow writing(?). I tried that in many different VMs and the results are kind of same.
I am able to simulate something similar with fio.
With block_size=4k and fsync=1 it gives 12MB/s, if block_size=4000 and fsync=40 SSD is fast as expected.
Any idea how to set the block_size or similar setting to saturate the disk so it can handle more logs/s?
Here are the results of fio:
fio --name TEST --eta-newline=5s --filename=fio-tempfile.dat --rw=write --size=500m --io_size=10g --blocksize=200k --ioengine=libaio --fsync=1 --iodepth=1 --direct=1 --numjobs=1 --runtime=60 --group_reporting
TEST: (g=0): rw=write, bs=(R) 200KiB-200KiB, (W) 200KiB-200KiB, (T) 200KiB-200KiB, ioengine=libaio, iodepth=1
fio-3.1
Starting 1 process
Jobs: 1 (f=1): [W(1)][11.7%][r=0KiB/s,w=17.6MiB/s][r=0,w=90 IOPS][eta 00m:53s]
Jobs: 1 (f=1): [W(1)][21.7%][r=0KiB/s,w=4400KiB/s][r=0,w=22 IOPS][eta 00m:47s]
Jobs: 1 (f=1): [W(1)][31.7%][r=0KiB/s,w=13.1MiB/s][r=0,w=67 IOPS][eta 00m:41s]
Jobs: 1 (f=1): [W(1)][41.7%][r=0KiB/s,w=9.78MiB/s][r=0,w=50 IOPS][eta 00m:35s]
Jobs: 1 (f=1): [W(1)][51.7%][r=0KiB/s,w=13.5MiB/s][r=0,w=69 IOPS][eta 00m:29s]
Jobs: 1 (f=1): [W(1)][62.3%][r=0KiB/s,w=8000KiB/s][r=0,w=40 IOPS][eta 00m:23s]
Jobs: 1 (f=1): [W(1)][72.1%][r=0KiB/s,w=12.1MiB/s][r=0,w=62 IOPS][eta 00m:17s]
Jobs: 1 (f=1): [W(1)][82.0%][r=0KiB/s,w=16.0MiB/s][r=0,w=87 IOPS][eta 00m:11s]
Jobs: 1 (f=1): [W(1)][91.8%][r=0KiB/s,w=5400KiB/s][r=0,w=27 IOPS][eta 00m:05s]
Jobs: 1 (f=1): [W(1)][100.0%][r=0KiB/s,w=15.4MiB/s][r=0,w=79 IOPS][eta 00m:00s]
TEST: (groupid=0, jobs=1): err= 0: pid=4978: Sat Oct  2 01:30:49 2021
  write: IOPS=57, BW=11.3MiB/s (11.8MB/s)(677MiB/60004msec)
    slat (usec): min=151, max=9712, avg=305.04, stdev=399.82
    clat (usec): min=2, max=259, avg= 3.44, stdev= 5.35
     lat (usec): min=154, max=9719, avg=309.68, stdev=400.23
    clat percentiles (usec):
     |  1.00th=[    3],  5.00th=[    3], 10.00th=[    3], 20.00th=[    3],
     | 30.00th=[    3], 40.00th=[    3], 50.00th=[    4], 60.00th=[    4],
     | 70.00th=[    4], 80.00th=[    4], 90.00th=[    4], 95.00th=[    5],
     | 99.00th=[    6], 99.50th=[   21], 99.90th=[   71], 99.95th=[   86],
     | 99.99th=[  260]
   bw (  KiB/s): min= 3585, max=18800, per=99.98%, avg=11556.20, stdev=5193.10, samples=120
   iops        : min=   17, max=   94, avg=57.66, stdev=25.96, samples=120
  lat (usec)   : 4=94.87%, 10=4.35%, 20=0.23%, 50=0.40%, 100=0.12%
  lat (usec)   : 500=0.03%
  cpu          : usr=0.16%, sys=0.62%, ctx=7379, majf=0, minf=11
  IO depths    : 1=100.0%, 2=0.0%, 4=0.0%, 8=0.0%, 16=0.0%, 32=0.0%, >=64=0.0%
     submit    : 0=0.0%, 4=100.0%, 8=0.0%, 16=0.0%, 32=0.0%, 64=0.0%, >=64=0.0%
     complete  : 0=0.0%, 4=100.0%, 8=0.0%, 16=0.0%, 32=0.0%, 64=0.0%, >=64=0.0%
     issued rwt: total=0,3468,0, short=0,0,0, dropped=0,0,0
     latency   : target=0, window=0, percentile=100.00%, depth=1

Run status group 0 (all jobs):
  WRITE: bw=11.3MiB/s (11.8MB/s), 11.3MiB/s-11.3MiB/s (11.8MB/s-11.8MB/s), io=677MiB (710MB), run=60004-60004msec
Update:
@jprante had commented something related but it was 8 years ago, maybe something have changed from then...


