Hi, everyone.
I'm currently struggling with a weird issue after upgrading Elasticsearch from 5.6.4 to 6.0.0 GA.
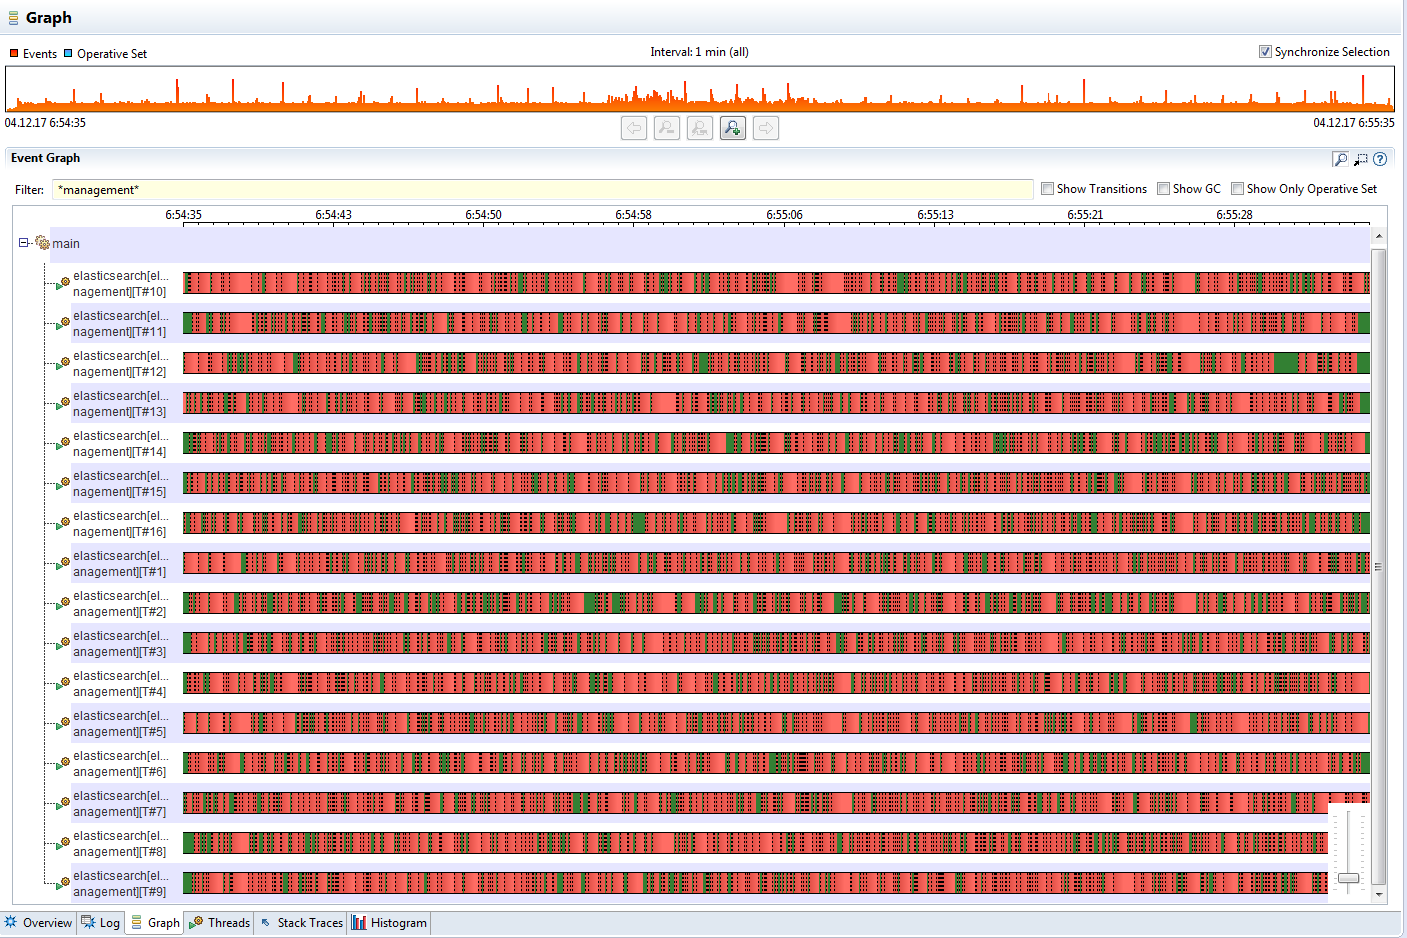
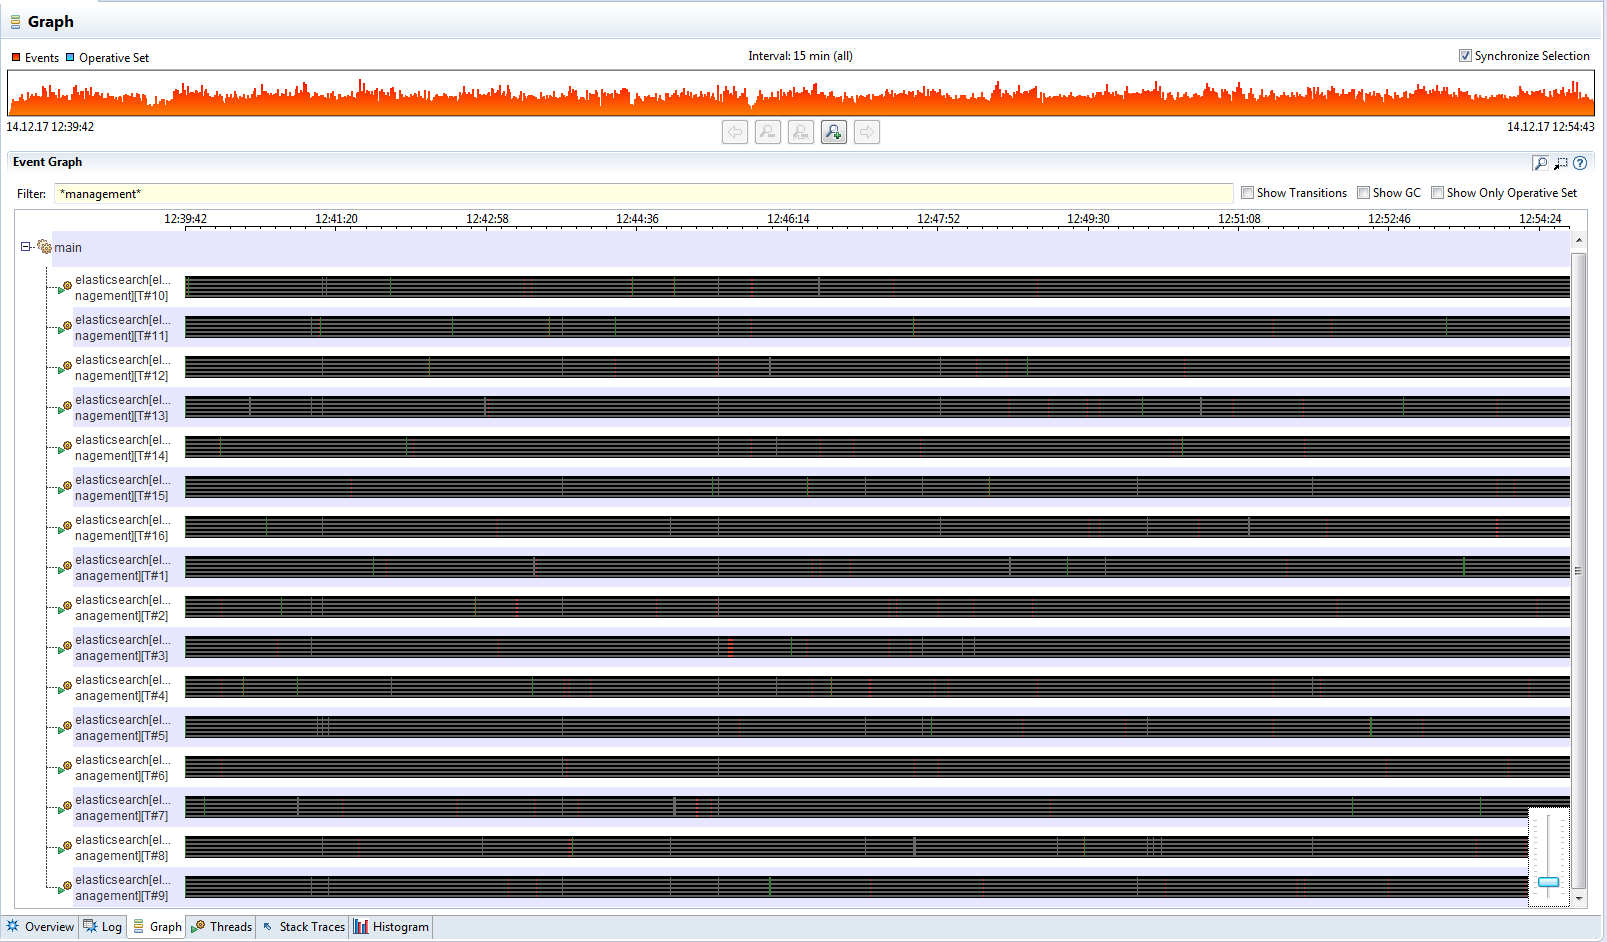
I did a rolling upgrade and I'm now seeing threads from the management pool almost constantly blocked on org.elasticsearch.index.translog.TranslogWriter.syncUpTo:
Stack Trace
elasticsearch[elastic-fk-node01][management][T#1] [86] (BLOCKED)
   org.elasticsearch.index.translog.TranslogWriter.syncUpTo line: 328
   org.elasticsearch.index.translog.TranslogWriter.sync line: 238
   org.elasticsearch.index.translog.Translog.sync line: 670
   org.elasticsearch.index.seqno.GlobalCheckpointSyncAction.shardOperationOnPrimary line: 119
   org.elasticsearch.index.seqno.GlobalCheckpointSyncAction.shardOperationOnPrimary line: 51
   org.elasticsearch.action.support.replication.TransportReplicationAction$PrimaryShardReference.perform line: 1033
   org.elasticsearch.action.support.replication.TransportReplicationAction$PrimaryShardReference.perform line: 1011
   org.elasticsearch.action.support.replication.ReplicationOperation.execute line: 104
   org.elasticsearch.action.support.replication.TransportReplicationAction$AsyncPrimaryAction.onResponse line: 358
   org.elasticsearch.action.support.replication.TransportReplicationAction$AsyncPrimaryAction.onResponse line: 298
   org.elasticsearch.action.support.replication.TransportReplicationAction$1.onResponse line: 974
   org.elasticsearch.action.support.replication.TransportReplicationAction$1.onResponse line: 971
   org.elasticsearch.index.shard.IndexShardOperationPermits.acquire line: 238
   org.elasticsearch.index.shard.IndexShard.acquirePrimaryOperationPermit line: 2188
   org.elasticsearch.action.support.replication.TransportReplicationAction.acquirePrimaryShardReference line: 983
   org.elasticsearch.action.support.replication.TransportReplicationAction.access$500 line: 97
   org.elasticsearch.action.support.replication.TransportReplicationAction$AsyncPrimaryAction.doRun line: 319
   org.elasticsearch.common.util.concurrent.AbstractRunnable.run line: 37
   org.elasticsearch.action.support.replication.TransportReplicationAction$PrimaryOperationTransportHandler.messageReceived line: 294
   org.elasticsearch.action.support.replication.TransportReplicationAction$PrimaryOperationTransportHandler.messageReceived line: 281
   org.elasticsearch.transport.RequestHandlerRegistry.processMessageReceived line: 66
   org.elasticsearch.transport.TransportService$7.doRun line: 659
   org.elasticsearch.common.util.concurrent.ThreadContext$ContextPreservingAbstractRunnable.doRun line: 638
   org.elasticsearch.common.util.concurrent.AbstractRunnable.run line: 37
   java.util.concurrent.ThreadPoolExecutor.runWorker line: 1149
   java.util.concurrent.ThreadPoolExecutor$Worker.run line: 624
   java.lang.Thread.run line: 748
I've attached several screenshots from JMC that demonstrate the problem.


Also, here is a full call tree for a file write to one of the translog files: https://pastebin.com/raw/56ZSkB3u.
Could this be somehow connected to the new sequence number system in ES 6.0.0?
I've never had this issue before upgrading to 6.0.0.
This situation is pretty bad, because I cannot even query "_nodes/stats" - the request just times out.
I'm also seeing higher than usual CPU usage (compared to other Sundays) and the master node is constantly complaining about timed out requests:
[2017-12-03T09:12:33,564][WARN ][o.e.t.TransportService ] [elastic-fk-node01] Received response for a request that has timed out, sent [18278ms] ago, timed out [3253ms] ago, action [cluster:monitor/nodes/stats[n]], node [{elastic-fk-node03}{ZwRuJpSMSNCgtMezxDVoPw}{Y_f-tf_cT-2IiLJJGH2h2w}{x.x.x.x}{x.x.x.x:9300}], id [50088016]
Here are some details about our cluster:
Elasticsearch version: 6.0.0 GA
Nodes: 3 (master+data+coordinating)
Heap size: 31GB
Java version: 1.8.0_144
OS: CentOS Linux release 7.4.1708
Kernel: 4.13.3-1.el7.elrepo.x86_64
Elasticsearch VMs specs: 16 vCPU, 64GB RAM
Our normal indexing speed during working hours is about 12000 docs per second with spikes up to 20000-22000 dps.
Right now I'm seeing around 5000-6000 docs per second, so the load on the cluster is not an issue.
There are currently 6750732469 documents (6.4TB including replicas), 260 indices and 1736 shards in the cluster.
Most indices have 3 shards and 1 replica.
Each index uses the following translog settings:
"translog" : {
  "flush_threshold_size" : "512mb",
  "sync_interval" : "15s",
  "durability" : "async"
},
The VMs are performing fine, CPU utilization is around 30% and there is plenty of available memory.
We've already tried lowering the flush threshold to 64mb, which didn't help at all.
I'd greatly appreciate any advice or guidance in this situation.