Mapping vars

hello dear,
I want to know, how better way to create mapping when I need to view my agent version follow your counts. I inser with post this logs in to variables:

category:  2.34.212,
agent_count: 480 
mapping:
        "categories":
        {
            "type": "nested",
            "properties":
            {
                "name":
                {
                    "type": "text",
                    "store": true
                }
            }
        },
"agent_count": 
        {
            "type": "integer"
        },

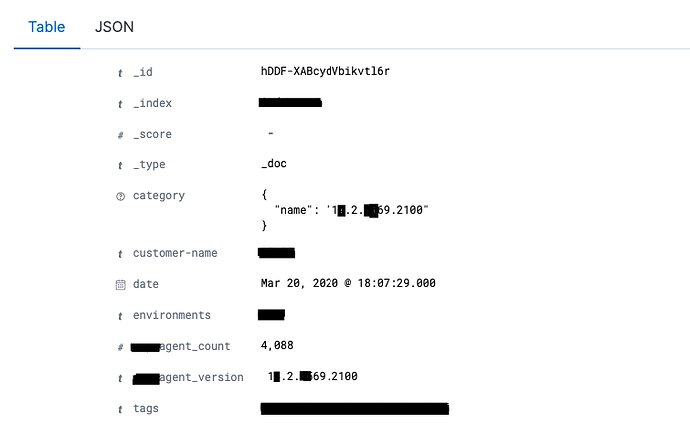
This insert run by hour in our cron.d. When I filter by therm I have both values, but separately, follow image bellow, can we help to unify this visualization?

Hi @edkash,

Just to make sure I understand: you are trying to visualize the total agent_count split by category.name?

One way that might be more effective than a pie chart would be to do a bar chart where you put Metrics > Sum > Agent Count (Y-axis), and Buckets > Terms > Category Name (X-axis).

This would give you a chart where you could view the total agent count per category. Would that achieve what you are looking for?

Hello @lukeelmers I tried with the count, but sum resolved this issue.
thank you

This topic was automatically closed 28 days after the last reply. New replies are no longer allowed.