Hi,I am having trouble using Hikari connection pool with java APM agent.
I meet Transaction Max spans warnning, when it happend at a transaction has more than spanLimited spans, which i set is 500. Then i found it happend always in HikariPool connection adder,but not in business thread,which is a thread that Hikari-pool use for keep normal connection count.
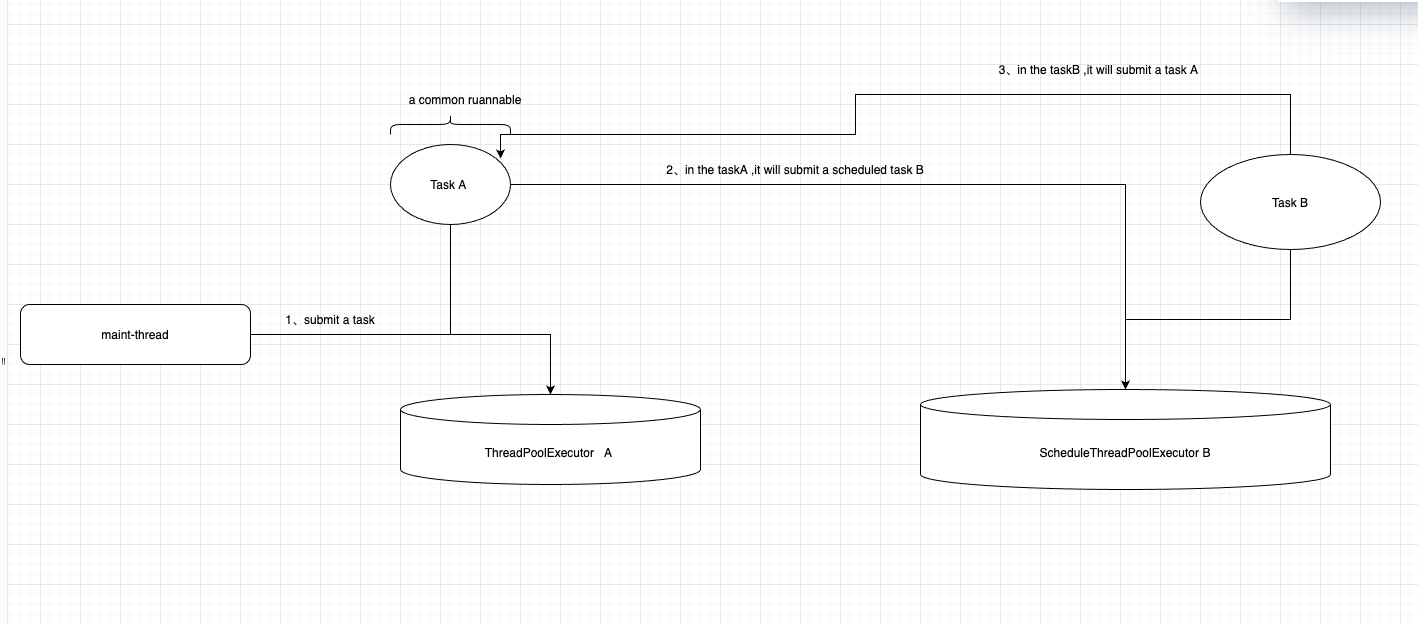
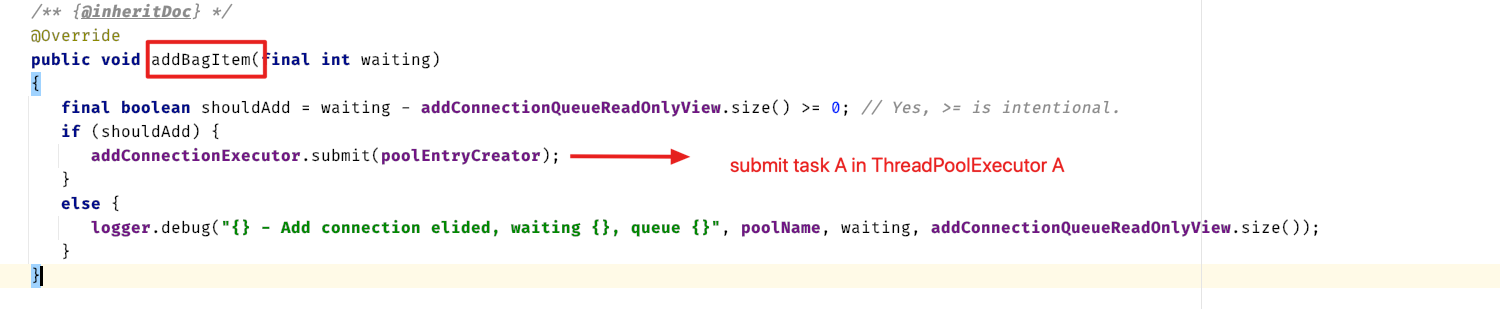
Then i read the source code,i found that when in com.zaxxer.hikari.pool.HikariPool#addBagItem ,it will submit a task ,which has a ScheduleTaskThreadPoolExecutor working in it,but the ScheduleTaskThreadPoolExecutor will submit the same task ,combined with apm-java-concurrent-plugin it will leak to the Transaction never end. Also,we improved "DataSource#getConnection" ,so that the Transaction will keep create spans .
If we need to fix this probleam, our team want to excluded "java.util.concurrent.ScheduledThreadPoolExecutor" in ExecutorInstrumentation.
I want to know if there has more suitable method to slove this probleam or is my guess correct?
Hi @fido and welcome to our forum!
Thanks for reporting.
Please try these two things and report back:
-
Try our latest snapshot and see if the problem persists. It contains a recent change to the way references of transactions and spans are managed in the concurrency plugin
-
If I understand this correctly:
Also,we improved "DataSource#getConnection" ,so that the Transaction will keep create spans`
you added some custom instrumentation. Please try the same scenario without any instrumentation other than the one the agent applies automatically. It is quite common for custom instrumentations to leak transactions/span due to improper reference counting.
Thanks for replying ! It seems like the recent change slove my probleam. But i read the change, it change the contextMap implement in JavaConcurrent and no need to control the reference change in restoreContext methord and captureContext method , but i still can not understand why it can work ?
The map was replaced with one that automatically manages the reference counting of spans/transactions in a way that accurately reflects how they are referenced by the map.
If you look at the former captureContext implementation, it would always try to put in the map AND increment references. If the span/transaction was already mapped to this key, its entry would only be replaced, but its ref counting would be increased as if there is an additional ref to it. If you look at the implementation of co.elastic.apm.agent.collections.SpanConcurrentHashMap#onPut that is now used instead, you would see that it handles it properly, meaning - the ref count will only account for one ref per map entry.
This is a bug fix to ref counting. What happens next with that I cannot say, either you relied on the ref count for something or that the agent does, causing further implications. For example, a transaction with ref count higher than 0 will never be recycled, so its child span count will never be reset.
I seems like understand your answer. I have another querstion, if the reference count is correct , the transaction has been ended and its state are reseted, but the submit task has been delay execute , such like ScheduleThreadPoolExecutor , Then,when the task is executed , is that the current thread tracer hold a transaction which is after recyle without any state? I am a fresh about apm-agent-java, i appreciate your understanding of all inconvenience that i brought to you.
That is the exact purpose of the contextMap - it stores references to spans/transactions so that they can be retrieved from other threads, and as long as they are in the map, their reference count cannot go to 0, so they won't be recycled (even if they are ended and reported).
When a task is submitted, it will be stored in the map as the key, where the value is the span/transaction that was active when it was submitted. When the task is executed, it will be retrieved from the map, together with the corresponding span/transaction.
I hope this clears things.
I use the lastest snapshot , but also has the same probleam. I add some logs for tracing, i found that the question is two executor exist loop call in HikariPool .
As you say, the former captureContext implementation may cause span/transaction incorrect ref counting, this can cause these objects can not be recycled, and make memory leak? But how does it can make max spans? Max spans will happened in transaction create span . Also, when deactivate a span, it will check if this span is the correct active span. I don't found this warn log in my program, it means that all the span/transaction in the tracer's activeStack are correctly handled. I draw a simple flowchart.
Here is some code in HikariPool

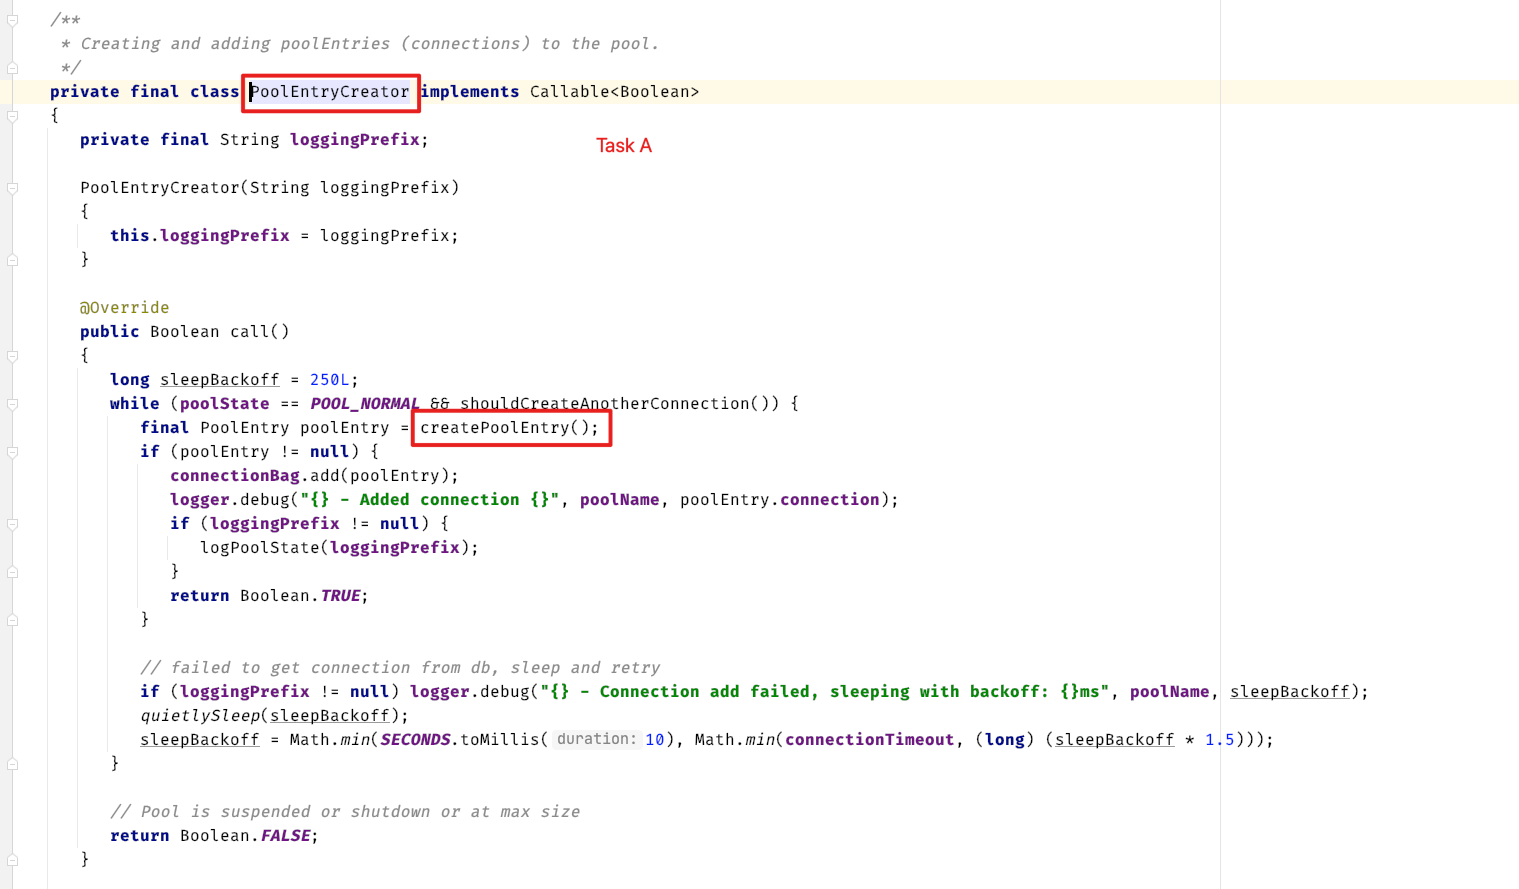

In createPoolEntry , it will create some span about sql . So, it seems like it will always keep the transaction , because is a circle , and although the ref count is correct and the activeStack in tracer is properly maintained.
I don't know if i speak clearly ?
It can cause spans to be garbage collected instead of recycled, but not a memory leak.
This definitely sounds related.
First step: please confirm that the problem still occurs after removing everything you did for manual tracing, relying only on automatic agent tracing. If you get the same behavior only with agent instrumentation, we will analyze further.
Yes,I remove all my tracing log , and use the lastest snapshot. It also has the probleam. As my flowchart,it seems like it's a normal sitution in the code ,because when submit a task,it will pass the transaction to a async thread. When two thread
keep passing each other‘s transaction. It will never end the transaction.
Your investigation and description of the problem are extremely useful, I didn't intend to doubt them. What I was missing is why these kept-alive transactions should bother us.
They are kept active on addConnectionExecutor and houseKeepingExecutorService, which employ house-keeping threads, so I didn't understand what spans are being created on these threads. Looking in the Hikari code now, I can see that these spans are probably related to the connection initiation SQL being executed to validate newly created connections.
The transactions should still be ended and sent normally, the only thing is that spans will continue to be created and sent as child spans. I tried a simple way to fix this issue, please try out the snapshot build and verify the issue is resolved with it.
Thanks a lot for your wonderful report and patience!
Yes,that's what i mean,please forgive me for my unclear expression.Your lastest bug fix can slove the probleam.
Thank you for your clear answer!
just to make sure I got this clear - can you confirm that you tested and the problem is eliminated with this fix?
Yes,i used the lastest snapshot from the snapshot build url. I use the same test code, the probleam not happened.
Awesome! Thanks for the great report and collaboration!