Message "failed to find message" event.dataset "cisco.asa"

Hello,

I have a problem with displaying parsed logs inside Kibana.

I am using Filebeat Cisco module to inser logs from file to Elasticsearch

I can see index of Filebeat

My Filebeat Cisco module configuration configuration is

`- module: cisco
asa:
enabled: true
var.paths: ["/var/log/syslog/asa1.log","/var/log/syslog/asa2.log"]
var.input: "file"
# Set which input to use between syslog (default) or file.
#var.input: syslog

# The interface to listen to UDP based syslog traffic. Defaults to
# localhost. Set to 0.0.0.0 to bind to all available interfaces.
# var.syslog_host: localhost

# The UDP port to listen for syslog traffic. Defaults to 9001.
#var.syslog_port: 514

# Set the log level from 1 (alerts only) to 7 (include all messages).
# Messages with a log level higher than the specified will be dropped.
# See https://www.cisco.com/c/en/us/td/docs/security/asa/syslog/b_syslog/syslogs-sev-level.html
#var.log_level: 5

ftd:
enabled: true

# Set which input to use between syslog (default) or file.
#var.input: syslog

# The interface to listen to UDP based syslog traffic. Defaults to
# localhost. Set to 0.0.0.0 to bind to all available interfaces.
#var.syslog_host: localhost

# The UDP port to listen for syslog traffic. Defaults to 9003.
#var.syslog_port: 9003

# Set the log level from 1 (alerts only) to 7 (include all messages).
# Messages with a log level higher than the specified will be dropped.
# See https://www.cisco.com/c/en/us/td/docs/security/firepower/Syslogs/b_fptd_syslog_guide/syslogs-sev-level.html
#var.log_level: 7

ios:
enabled: true

# Set which input to use between syslog (default) or file.
#var.input: syslog

# The interface to listen to UDP based syslog traffic. Defaults to
# localhost. Set to 0.0.0.0 to bind to all available interfaces.
#var.syslog_host: localhost

# The UDP port to listen for syslog traffic. Defaults to 9002.
#var.syslog_port: 9002

# Set custom paths for the log files when using file input. If left empty,
# Filebeat will choose the paths depending on your OS.
#var.paths:`

Inside Kibana/Siem i can only see

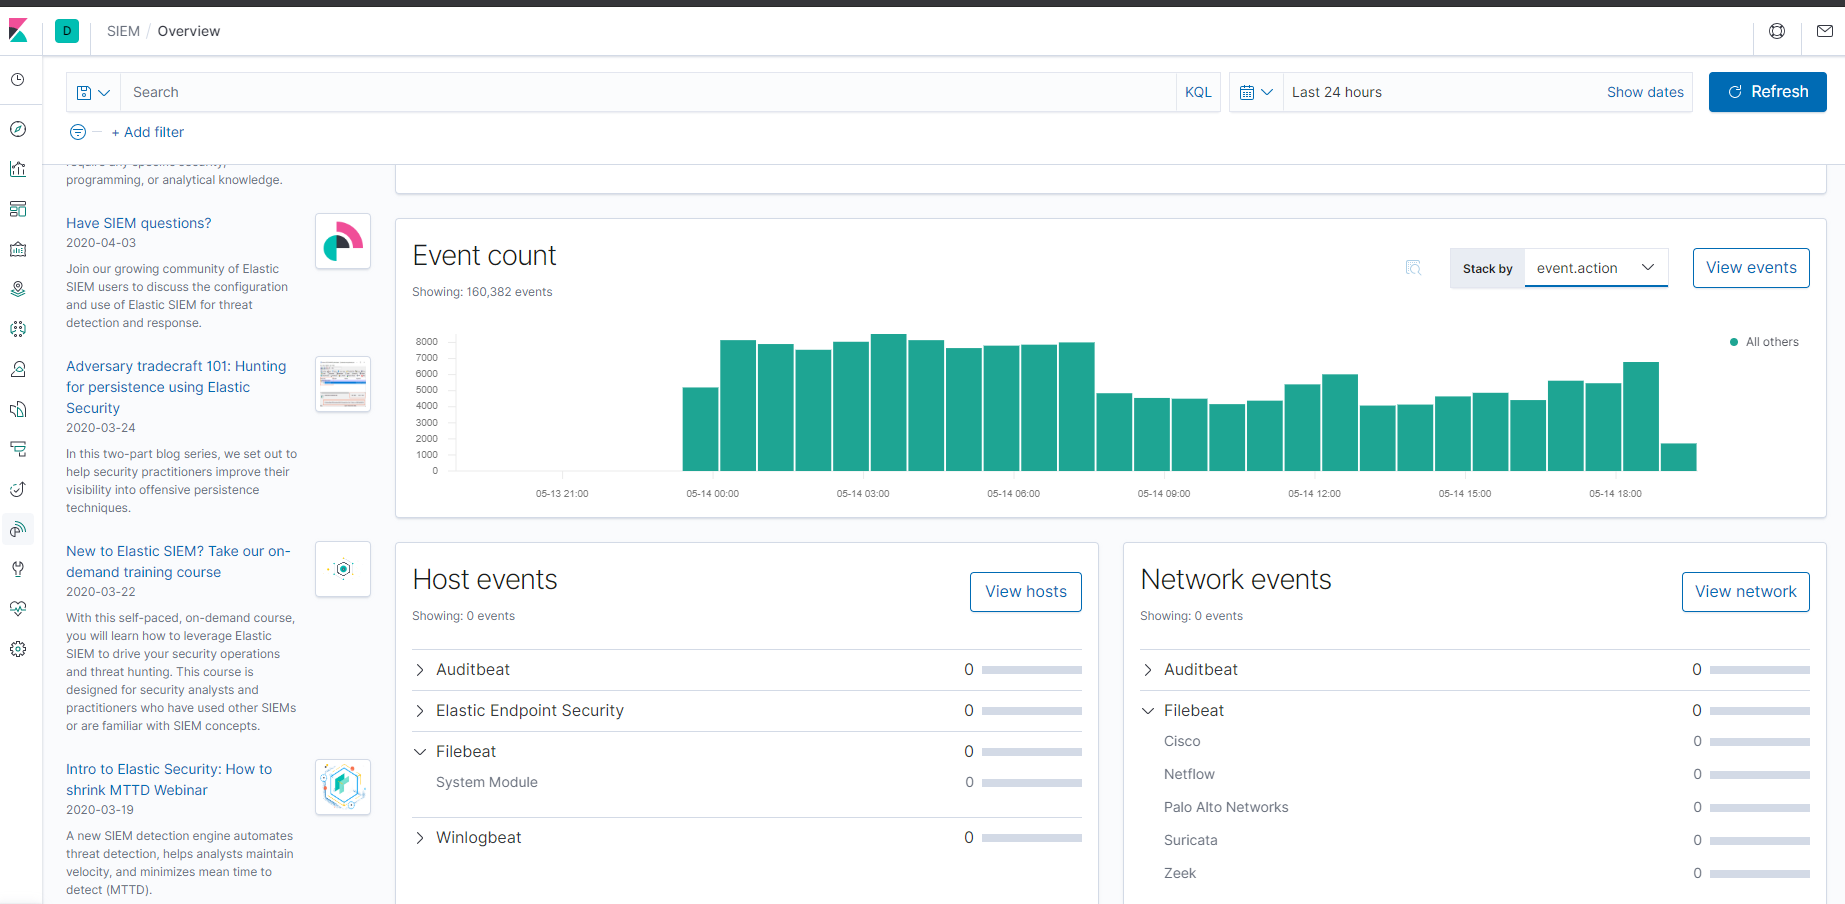
and that's how logs looks inside Kibana

Default Cisco Asa Dashborad has no data

How can I approach debugging of this issue?

Hello,

I have checked today's the logs output and I can see some log messages in the feed.

Is then failed to find a message something "normal"? How can I get ride of IT?

I am on Filebeat,Elasticsearch,Kibana version .x86_64 7.6.2-1 Centos 7

Is this maybe a problem with encoding? My logs are in

# file -i /var/log/syslog/Asa1.log
/var/log/syslog/Asa1.log: text/plain; charset=us-ascii

After reading this post I Issued "logging device-id hostname" command on the ASA devices.

Now I can see below messages in the "Logs" tab

I sarted to see Network events from Filebeat Cisco module in SIEM

I also see that not all logs are passed correctly. Is this behavior a bug or I can help Filebeat by issuing some command on an ASA?

I can see now some data in default dashboard

Is it proper to have config like below or should i delete the paths for asa or ftd?

  • module: cisco
    asa:
    enabled: true
    var.paths: ["/var/log/syslog/ASA1.log","/var/log/syslog/ASA2.log"]
    var.input: "file"

    ftd:
    enabled: true
    var.paths: ["/var/log/syslog/ASA1.log","/var/log/syslog/ASA2.log"]
    var.input: "file"

Glad to see you found a solution for your initial problem.

Regarding the parsing errors for some messages, can you share an anonymized version of their event.original field along with error.message? This will help a lot in fixing the problem.

Also, for your sample configuration, the FTD parses all the messages in ASA plus a few more, so you can ingest this file using only the ftd fileset and disable asa, otherwise you'll have a lot of duplicates.

Hello Adrian,

thank you for your replay

Do you want this data in other format or anonymized in other way?

Additionally I have deleted the old Filebeat index and restarted filebeat elasticsearch and kibana services.

I also noticed after deleting files path config from Asa part in cisco.yml file I stopped seeing new data inside ASA Firewall dashboard. Is there a way to no duplicate entries?

After some proper configuration, I can see all the dashboard field with data.

In filebeat journal I can read.

May 27 19:45:28 pl-.pl filebeat[1052]: 2020-05-27T19:45:28.850+0200 WARN [elasticsearch] elasticsearch/client.go:384 Cannot index event publisher.Event{Content:beat.Event{Timestamp:time.Time{wall:0xbfabc7abe6e600a0, ext:2375418903539, loc:(*time.Location)(0x594e5e0)}, Meta:{"pipeline":"filebeat-7.7.0-cisco-asa-asa-ftd-pipeline"}, Fields:{"agent":{"ephemeral_id":"d5ac0651-7fa2-41cb-92ce-d6f1a5f67de7","hostname":"pl-s950net-tools.cp.pl","id":"4b069842-f4a1-4420-9a89-7e093d2cba6f","type":"filebeat","version":"7.7.0"},"ecs":{"version":"1.5.0"},"event":{"dataset":"cisco.asa","module":"cisco","timezone":"+02:00"},"fileset":{"name":"asa"},"host":{"architecture":"x86_64","containerized":false,"hostname":"pl-s950net-tools.cp.pl","id":"41c28f6d08964fcab092cb65e2cc5c18","ip":["ip"],"mac":["00:50:56:","f6:f5:d8:6"],"name":"pl-.pl","os":{"codename":"Core","family":"redhat","kernel":"3.x86_64","name":"CentOS Linux","platform":"centos","version":"7 (Core)"}},"input":{"type":"log"},"log":{"file":{"path":"/var/log/syslog/FWName.log"},"offset":9165815},"message":"2020-05-27T18:45:17+02:00 FWname : %ASA-6-302021: Teardown ICMP connection for faddr ff02::1/0 gaddr fe80::101:1ff:fe00:2/0 laddr fe80::200:1ff:fe00:1/0 type 134 code 0 ","service":{"type":"cisco"},"tags":["cisco-asa"]}, Private:file.State{Id:"", Finished:false, Fileinfo:(*os.fileStat)(0xc000593d40), Source:"/var/log/syslog/FWname.log", Offset:9165984, Timestamp:time.Time{wall:0xbfabc55f148feb00, ext:20111271980, loc:(*time.Location)(0x594e5e0)}, TTL:-1, Type:"log", Meta:map[string]string(nil), FileStateOS:file.StateOS{Inode:0x10004a37, Device:0xfd00}}, TimeSeries:false}, Flags:0x1, Cache:publisher.EventCache{m:common.MapStr(nil)}} (status=400): {"type":"mapper_parsing_exception","reason":"failed to parse field [source.nat.ip] of type [ip] in document with id 'JOQ9V3IB7flxVIMxNW6c'. Preview of field's value: ':200:1ff:fe00:1'","caused_by":{"type":"illegal_argument_exception","reason":"':201:1fa:fe10:1' is not an IP string literal."}}

Should that happen?

Hi Adrian,

I noticed that cisco module works opposite to what you said. When I disable asa module I got nothing on a default Cisco dahsboard but when I disable ftd I don't see any data lose. Could you explain that kind of behavior?

The dashboard is using fields from the Cisco ASA module. Those are:

cisco.asa.field_name

They should be renamed to:

cisco.ftd.field_name

You mean I should do the change in dashboard configuration or that It should be change with next filebeat release?

Yes, can you change the existing dashboard to see if that works?

I have changed the filed as shown below and enabled "ftd" and disabled "asa" in ~/modules.d/cisco.yml.

But i notice in the request there is

 "query": {
    "bool": {
      "must": [],
      "filter": [
        {
          "match_all": {}
        },
        {
          "bool": {
            "should": [
              {
                "exists": {
                  "field": "cisco.asa.message_id"
                }
              }
            ],
            "minimum_should_match": 1
          }

I made the request manually with proper "field" name in query bool filter and there was a match.

sudo curl --cacert /etc/elasticsearch/certs/ca/ca.crt -u elastic 'https://ip:9200/_search?pretty' --request GET -H 'Content-Type: application/json' --data '{

head -n 40 elastic.file
    {
      "took" : 195,
      "timed_out" : false,
      "_shards" : {
        "total" : 24,
        "successful" : 20,
        "skipped" : 0,
        "failed" : 4,
        "failures" : [
          {
            "shard" : 0,
            "index" : ".async-search",
            "node" : "clISm-CjRtKnMgvBhh6_AQ",
            "reason" : {
              "type" : "query_shard_exception",
              "reason" : "No mapping found for [@timestamp] in order to sort on",
              "index_uuid" : "jv9H9TL6R1a1pp-gciP66Q",
              "index" : ".async-search"
            }
          },
          {
            "shard" : 0,
            "index" : ".kibana_1",
            "node" : "clISm-CjRtKnMgvBhh6_AQ",
            "reason" : {
              "type" : "query_shard_exception",
              "reason" : "No mapping found for [@timestamp] in order to sort on",
              "index_uuid" : "gzGEfeoyQGmNMuGSRR1Pew",
              "index" : ".kibana_1"
            }
          },
          {
            "shard" : 0,
            "index" : ".kibana_task_manager_1",
            "node" : "clISm-CjRtKnMgvBhh6_AQ",
            "reason" : {
              "type" : "query_shard_exception",
              "reason" : "No mapping found for [@timestamp] in order to sort on",
              "index_uuid" : "yuXVxi0OSxOe2ZNkdjCy1w",
              "index" : ".kibana_task_manager_1"
            }
          },
          {
            "shard" : 0,
            "index" : ".security-7",
            "node" : "clISm-CjRtKnMgvBhh6_AQ",
            "reason" : {
              "type" : "query_shard_exception",
              "reason" : "No mapping found for [@timestamp] in order to sort on",
              "index_uuid" : "APp3J8HeTjSgeSh1Toz0xQ",
              "index" : ".security-7"
            }
          }
        ]
      },
      "hits" : {
        "total" : {
          "value" : 10000,
          "relation" : "gte"
        },
        "max_score" : null,
        "hits" : [ ]
      },
      "aggregations" : {
        "2" : {
          "doc_count_error_upper_bound" : 0,
          "sum_other_doc_count" : 13855,
          "buckets" : [
            {
              "key" : "752015",
              "doc_count" : 3,
              "5" : {
                "doc_count_error_upper_bound" : 0,
                "sum_other_doc_count" : 0,
                "buckets" : [
                  {
                    "key" : "FW",
                    "doc_count" : 3,
                    "1" : {
                      "hits" : {

This topic was automatically closed 28 days after the last reply. New replies are no longer allowed.