Metricbeat dashboard strange behaviour

Hi all. I am using elastic.co cloud 7.11.1 and I have 2 different metricbeat sitting in 2 different k8s clusters sending all the metrics to ELK. The first one works fine and I can see all the metrics in kibana but when I turn the second metricbeat all the node (but also all the other metrics ) will be added to the dashboard which is wrong. Both metricebeats have different index. What is wrong?

For instance, if I have 6 k8s nodes in one cluster and 9 in the 2nd one, in the dashboard I ll see 15 nodes.
The first metrics is on one index metricbeat-7.10.2-2021.01.19-000001 and the second one is essentia-metrics-dev-7.10.2-2021.03.16.

any clue?
Cheers

Hi all.
anyone on this?

what a strange thing. Even if I put tags, different index and different space id ...still I get ALL the metrics from different k8s cluster in the same dashboard.

anyone can explain?

cheers

@alfredo.deluca , next week I'd like to reproduce your setup in a lab. Would you please share the configuration of the 2 different metricbeats?
Also include some screenshots and details about the dashboards, to understand what exact dashboard you are using (note: shouldn't you create 2 different dashboards / visualizations to access specific clusters data?).

When fetching data (metrics & logs) from multiple kubernetes clusters at the moment there isn't any easy way to differentiate them, as in the schema there isn't anything like a cluster_id or cluster_name at k8s level.

But if you are sending the data to different indices, and if the dashboards and visualizations are configured to access the right index pattern I agree you should be able to control what cluster to visualize.

Also please confirm that you are using a standard dashboards and not the Metrics UI inside the Observability App.

1 Like

Thanks Eduardo.
I will share my conf and more details later on. For sure we are using different indices for 2 different metricbeat/dashboards and I am not using the Observability App.

Cheers

Cheers

Hi Eduardo.
So I use metricbeat helm 7.10.2 (I will upgrade to 7.12 soonish) and basically my 2 values.yaml from 2 different kubernetes clusters are in attachment.
They are pretty much identical except the index,index_patttern etc etc are different (you'll see both in the daemonset and deployment section). Of course I omitted the cloud.id and cloud.auth.

As far as I understand, when metricbeat starts, uploads all the default dashboards and visualize libraries including, of course, those for Kubernetes.

Let me know if you have any other questions.
Cheers

(Attachment essentia.yaml is missing)

(Attachment nlapi.yaml is missing)

sorry.. got blocked the yaml files.

here are the pastebin ref.

Thanks for sharing the manifests @alfredo.deluca !

However I still need to see the issue, as I'd like to check what type of dashboards we are talking about and how exactly the visualizations are configured (the index-patterns being pointed by the visualizations). Would you please share some screenshots showing the problem?

  • Show a screenshot showing the 15 hosts in a dashboard.
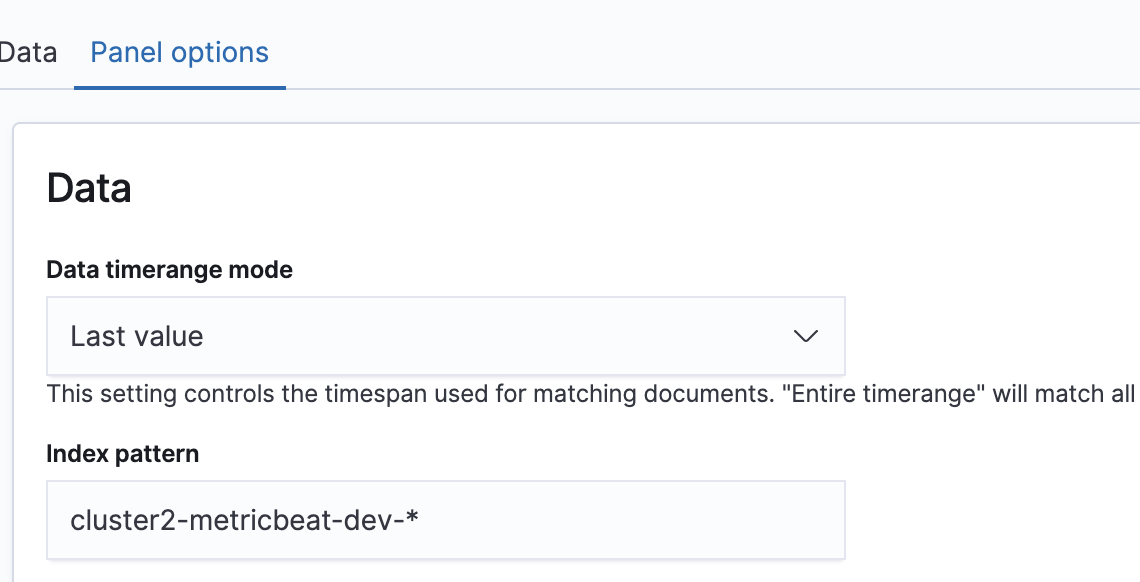
  • Then Edit the visualization and show the associated index pattern.

FYI, I have reproduced your setup using a similar configuration and all worked great with 7.11.2.

Here you have my setup:

  • Kibana: Already created spaces cluster1 and cluster2.

  • Cluster1 Metricbeat:

    setup.ilm.enabled: false
    setup.kibana:
      host: "https://MY-CLOUD-KIBANA:9243"
      space.id: "cluster1"
    setup.template.name: "cluster1"
    setup.template.pattern: "cluster1-metricbeat-dev-*"

    setup.dashboards:
      enabled: true
      beat: metricbeat
      index: "cluster1-metricbeat-dev-*"

    output.elasticsearch:
      hosts: ["https://MY-CLOUD-CLUSTER:9243"]
      index: "cluster1-metricbeat-dev-%{[agent.version]}-%{+yyyy.MM.dd}"
      username: "elastic"
      password: "my_password"
  • Cluster2 Metricbeat:
    setup.ilm.enabled: false
    setup.kibana:
      host: "https://MY-CLOUD-KIBANA:9243"
      space.id: "cluster2"
    setup.template.name: "cluster2"
    setup.template.pattern: "cluster2-metricbeat-dev-*"

    setup.dashboards:
      enabled: true
      beat: metricbeat
      index: "cluster2-metricbeat-dev-*"

    output.elasticsearch:
      hosts: ["https://MY-CLOUD-CLUSTER:9243"]
      index: "cluster2-metricbeat-dev-%{[agent.version]}-%{+yyyy.MM.dd}"
      username: "elastic"
      password: "my_password"

I built this based on your config files (btw, nice plan about separating the dashboards in different spaces) and the dashboards + index patterns were created in the right dashboards. Also each of the dashboards was pointing correctly to the right pattern.

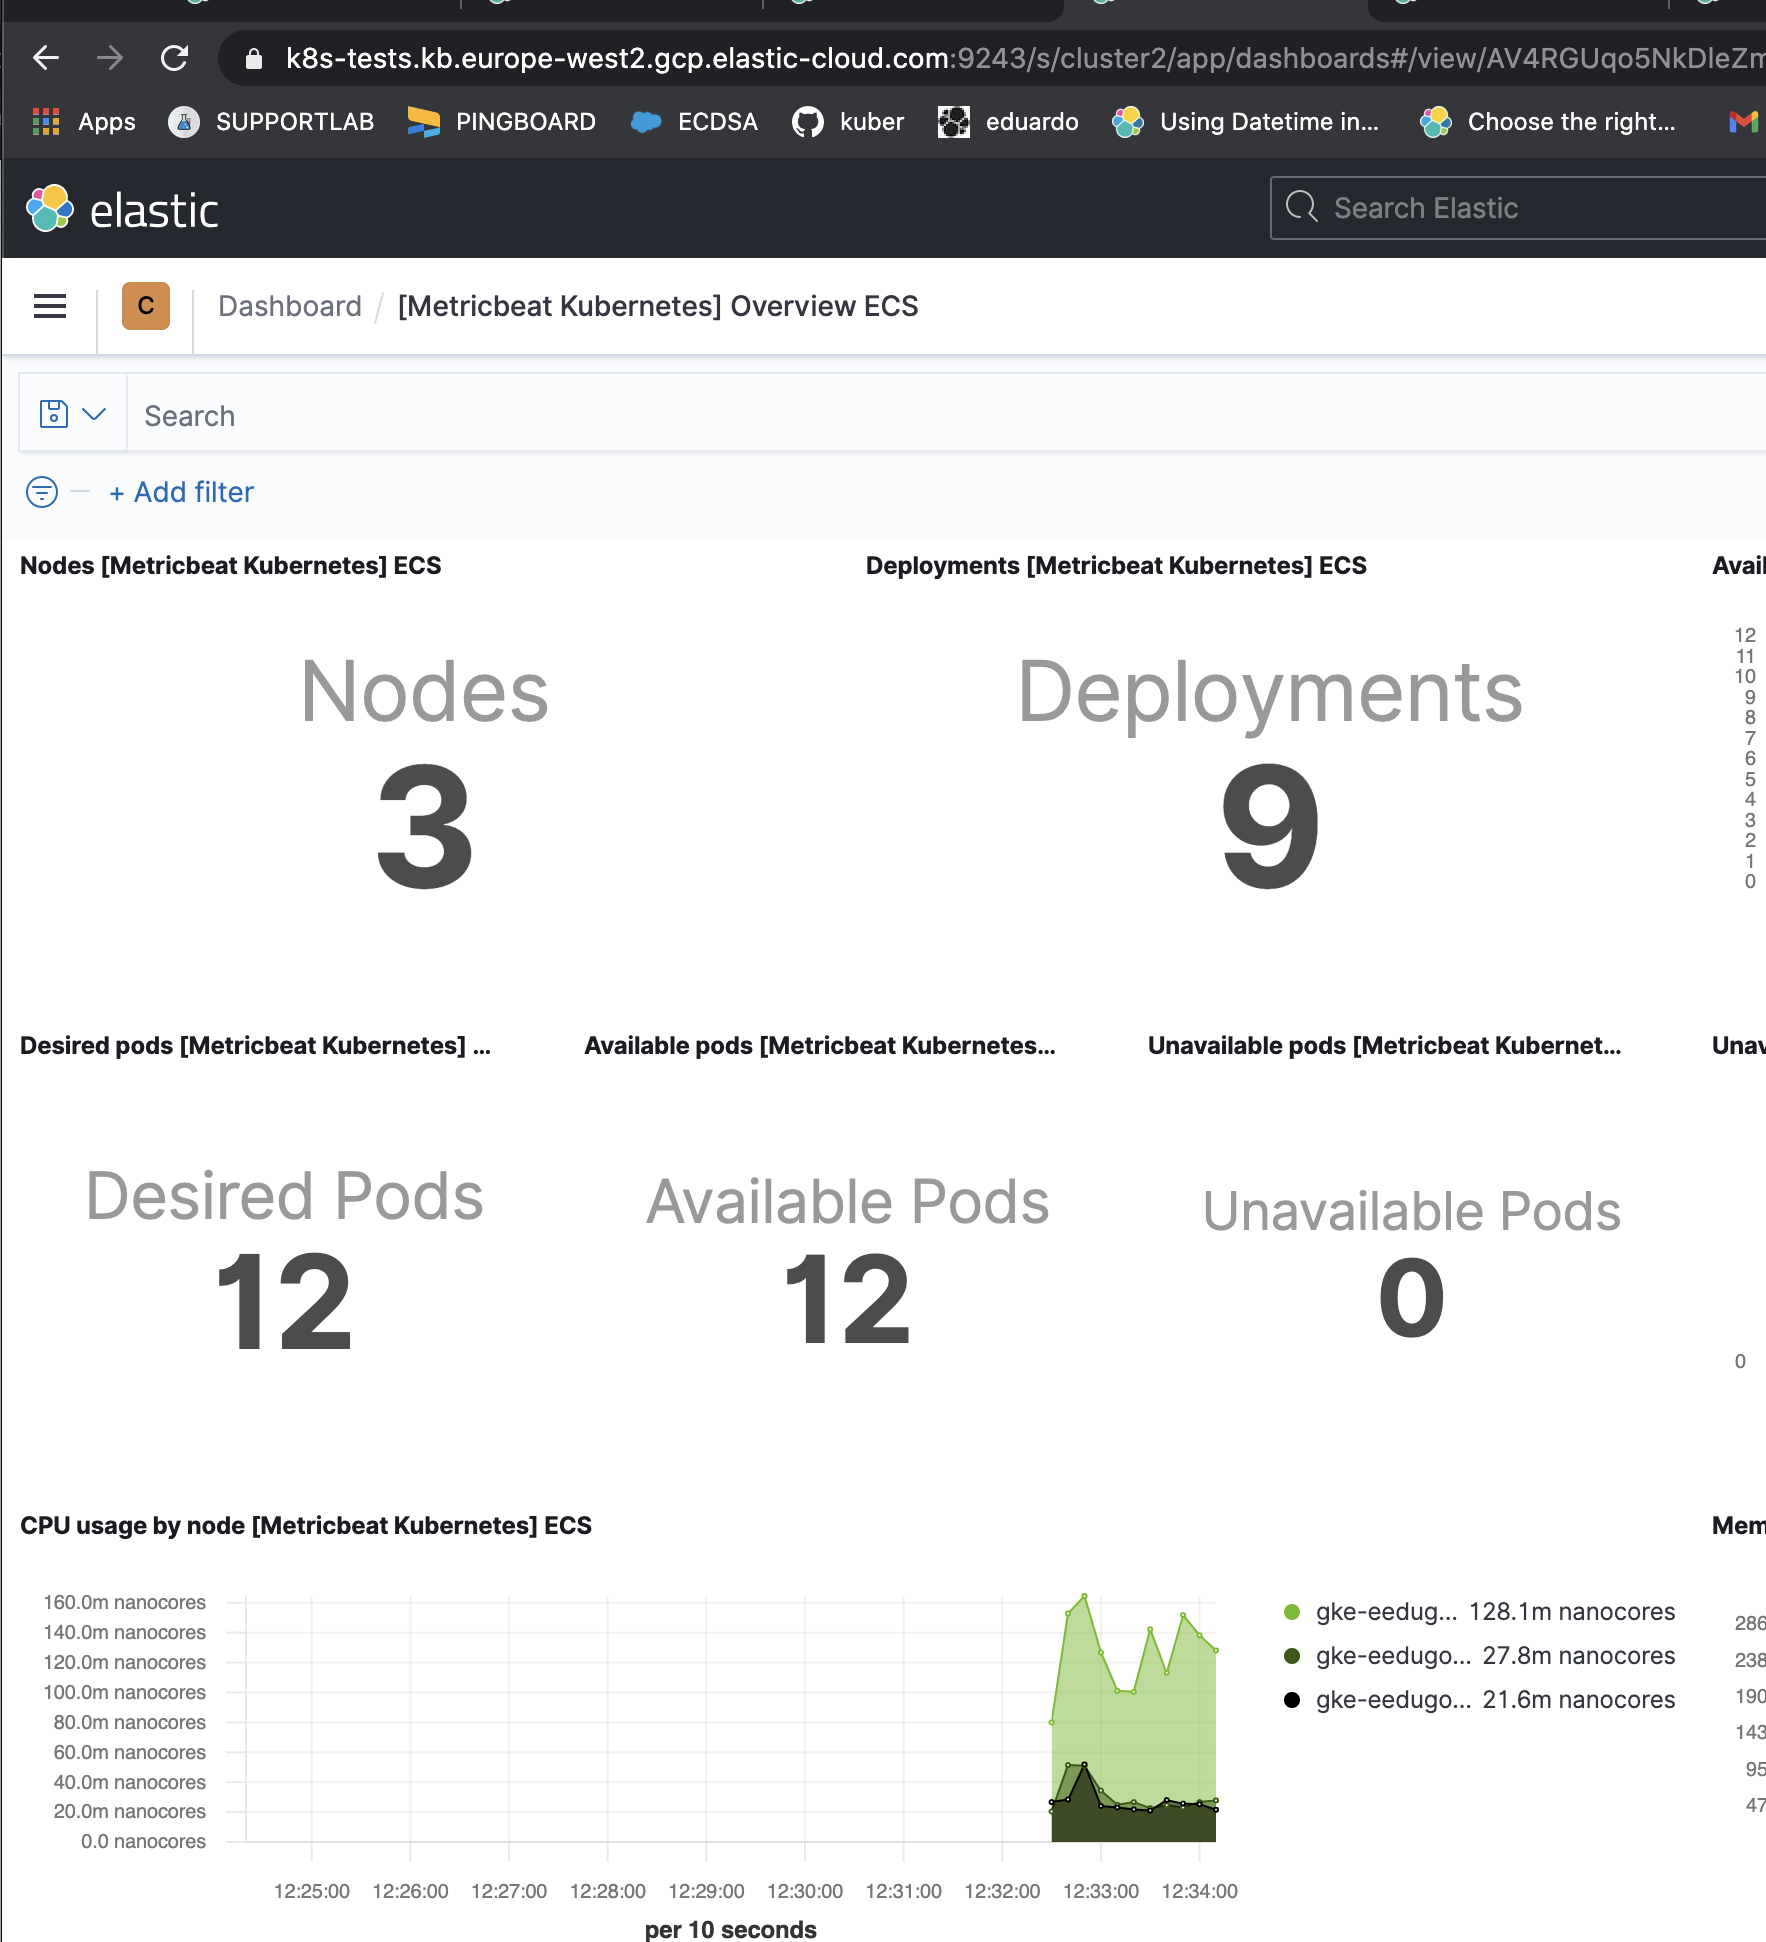
Attaching some screenshots of the result, showing cluster1 space::

  • Data split in multiple indices:

  • Cluster1 Nodes Visualization of default Kubernetes Overview ECS dashboard. We can see how it points to the right pattern:

  • Cluster1 Dashboard:

Cluster2 space looks as expected, using its own pattern:

As a final comment, in the default namespace all the dashboards were created pointing to the default data metricbeat-* (because of my initial config for testing purposes), which obviously didn't show any data. I updated manually some visualizations to point to cluster* and that made to obtain the data from all clusters together, also as expected.

I hope this helps you to find out why exactly your dashboards are showing the combined data. Once we clarify that we should be able to determine the best movement.

Please share some details of your issue from the dashboards and visualizations point of view if you want me to take a deeper look.

1 Like

Hi @eedugon thanks for your info.
I will go through your email later on. For now

  • when you set beat: metricbeat
    is just to upload the metricbeat dashboars and not all the others?
  • Every time you start the metricbeat, will it upload and override the existing dashboards as fas as you know?

Cheers

This topic was automatically closed 28 days after the last reply. New replies are no longer allowed.