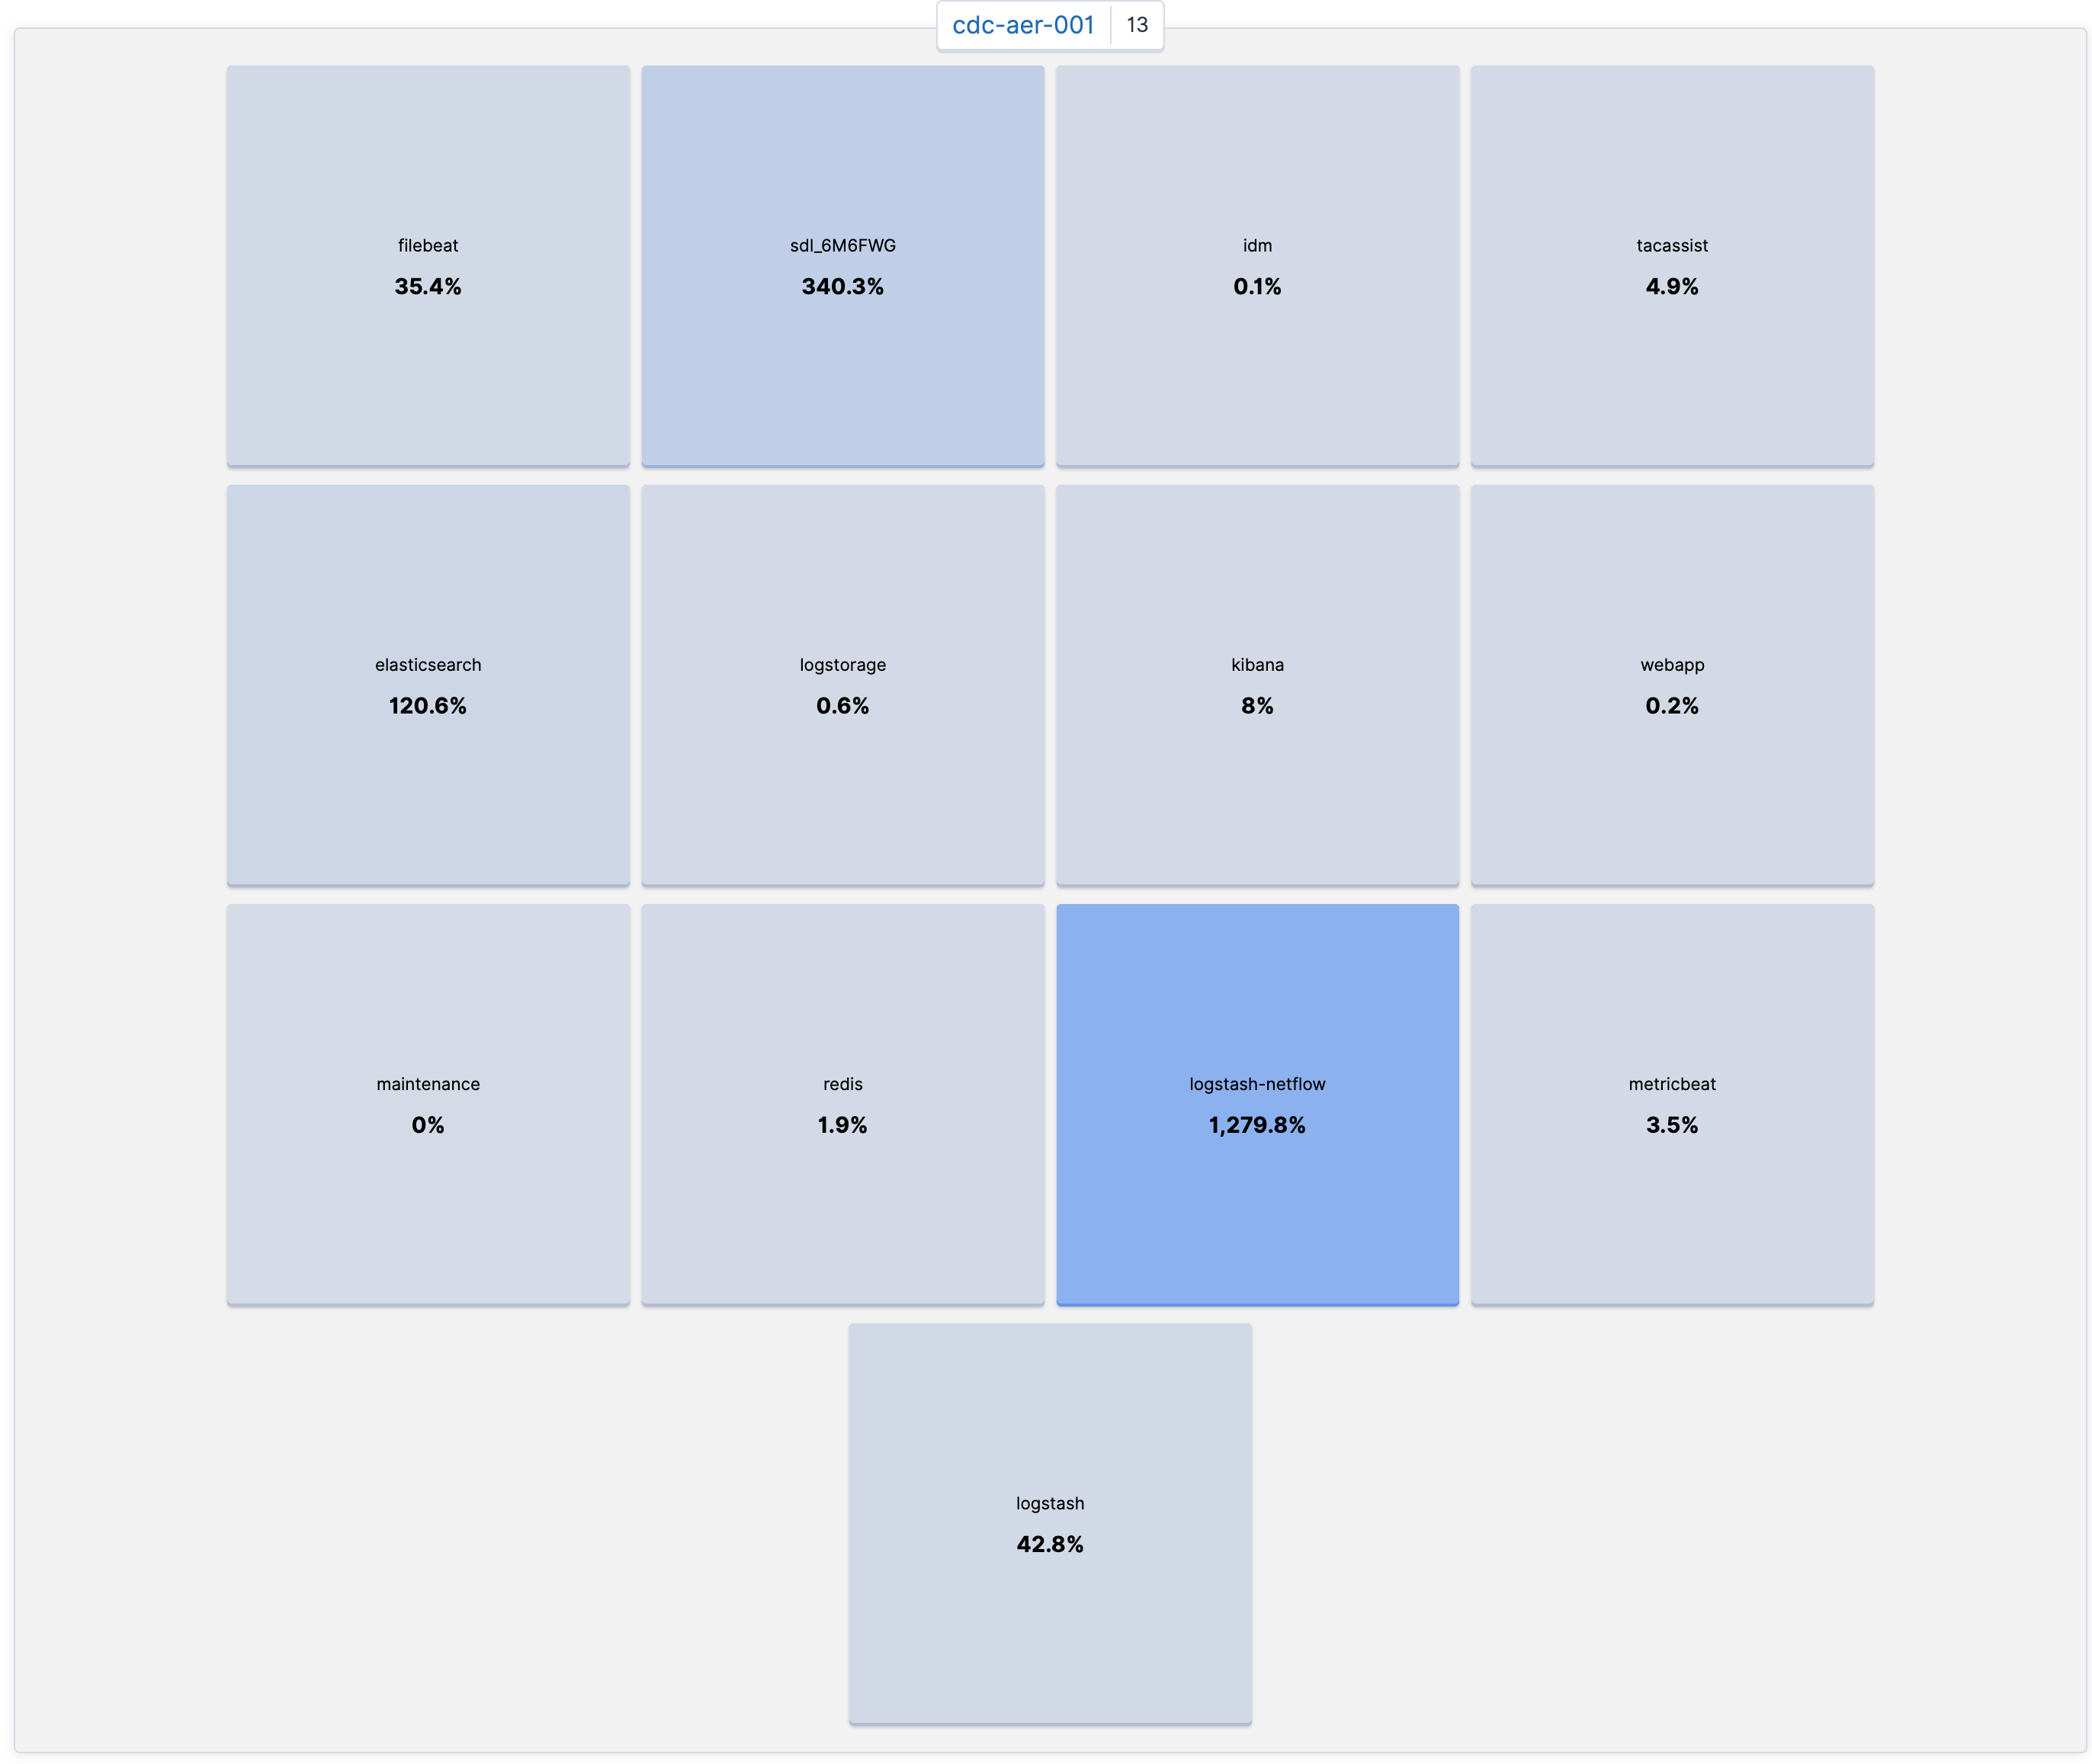
I’m getting weird perf stats on logstash-netflow. Seems like the docker API perf mon says it is using 1200% CPU, but the actual logstash monitoring shows 8% CPU. Also htop also show lots of CPU headroom.


Hi @sgreszcz,
it's hard to determine the possible causes based on these screenshots. Here's a few things that might help narrow it down:
- Which version of metricbeat and Kibana are you running?
- What are the filter and group parameters used in the last screenshot?
- Is the logstash process the only one running in the docker container?
- Does
docker statsreport correct values for the container?