6igwig
February 21, 2024, 7:01pm
41
Also
/usr/bin/metricbeat test modules

elasticsearch...
  ccr...
    error... ERROR timeout waiting for an event
  enrich...
    error... ERROR timeout waiting for an event
  cluster_stats...
    error... ERROR timeout waiting for an event
  index...
    error... ERROR timeout waiting for an event
  index_recovery...
    error... ERROR timeout waiting for an event
  index_summary...
    error... ERROR timeout waiting for an event
  ml_job...
    error... ERROR timeout waiting for an event
  node_stats...OK

  shard...
    error... ERROR timeout waiting for an event
kibana...
  stats...OK

  cluster_rules...OK

  node_rules...OK

  node_actions...OK

system...
  cpu...OK

  load...OK

  memory...OK

  network...OK

  process...OK

  process_summary...OK

  socket_summary...OK

system...
  filesystem...OK

  fsstat...OK

system...
  uptime...OK
stephenb
February 21, 2024, 7:05pm
42
check for any extra .yml files in the module directory... they all get concatenated together...
Weird ... you have some issues there ... Ohh node stats ok
Wierd but I would expect shards index etc to all be good
6igwig
February 21, 2024, 7:07pm
43
Logs from the new basic elastic cluster are showing up in the .ds-.monitoring-es-8-mb-2024.02.21-006828 index now! The new cluster still is not showing in Stack Monitoring though
stephenb
February 21, 2024, 7:10pm
44
What License to you have?
1 Like
6igwig
February 21, 2024, 7:14pm
45
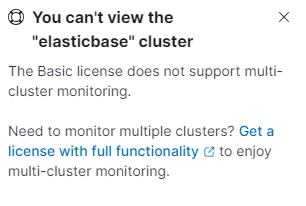
We have a Platinum license on our monitoring cluster and a Basic license on the new cluster I am trying to monitor.
I actually just saw the new elastic cluster pop up in Stack Monitoring of our monitoring cluster and when I tried to click on it it showed this error
stephenb
February 21, 2024, 7:15pm
46
Yup if you turn a trial and reload the page and restart the metricbeat it should show up...
I just tested that and got the same results... enabled trial and it worked
But yeah they all need licenses if you are going to configure that way
6igwig
February 21, 2024, 7:16pm
47
The elasticbase cluster did not show up in Stack Monitoring of the monitoring cluster until I changed the scope in elasticsearch-xpack.yml to "cluster" and specified both elastic hosts in the hosts parameter.
New elasticsearch-xpack.yml:
# Module: elasticsearch
# Docs: https://www.elastic.co/guide/en/beats/metricbeat/7.10/metricbeat-module-elasticsearch.html

- module: elasticsearch
  xpack.enabled: true
  metricsets:
    - node
    - node_stats
    - cluster_stats
    - enrich
    - index
    - index_recovery
    - index_summary
    - ingest_pipeline
    - pending_tasks
    - shard
    - ml_job
  period: 10s
  hosts: ["https://elasticbase1.mynetwork.com:9200","https://elasticbase2.mynetwork.com:9200"]
  scope: cluster
  username: "remote_monitoring_user"
  password: "${remote_monitoring_password}"
  ssl:
    enabled: true
    verification_mode: "certificate"
6igwig
February 21, 2024, 7:17pm
48
Thank you so much for your help dogging this out @stephenb !!
1 Like
stephenb
February 21, 2024, 7:18pm
49
Yes make sense... I asked you earlier if you were putting on each node / cluster etc...
But that is all good ... but now you have the license issue.... that will be an issue.
You need to apply a license to the base cluster or self-monitor or monitor to a single monitoring cluster those are your choices
6igwig
February 21, 2024, 7:20pm
50
Understood! I'll have to think about these options. Really wish I could just monitor with our existing monitoring cluster
leandrojmp
February 21, 2024, 8:12pm
51
That's what I mentioned earlier, the documentation could be more clear, it says that a License is required, but it does not say that both cluster needs to have a license.
I assumed that because this is how it works for other licensed features like CCR.
2 Likes
system
March 20, 2024, 10:13pm
52
This topic was automatically closed 28 days after the last reply. New replies are no longer allowed.
