Thanks for your interest!
Den tirsdag den 4. oktober 2011 23.42.43 UTC+2 skrev ppearcy:
Curious, how do things look if you set index op_type to create, as
discussed here:
Elasticsearch Platform — Find real-time answers at scale | Elastic
I believe that should mitigate any time spent in
loadCurrentVersionFromIndex.
Do I understand you right, that using op_type create is cheaper than using
op_type index?
I will try it out, but I guess getting rid of loadCurrentVersionFromIndex
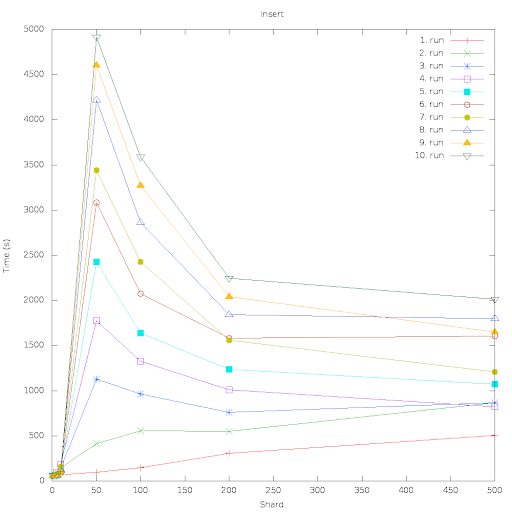
does not change the fact that things are running much slower with 50 shards
than it does with 1 shard - even though the amount of work (number of
index-operations) is the same.
With the default “put-if-absent” behavior a search needs to be done
across all the indices for every document submitted. From my (limited)
understanding that should be the main overhead of having so many
shards.
Looking at my profiling it is clear that loadCurrentVersionFromIndex takes
its share of the reason that it is much slower with 50 shards than with 1
shard, but its is not the full explanation - IndexWriter.addDocument and
Translog.add is also much slower in average per call.
Also, just curious, what method did you use for profiling? I'm not too
versed in this realm and got pretty fed up when I tried to use the
perfanal tool.
Earlier in my career I was employed in a small (well it was at that time)
danish company called Trifork (www.trifork.com). A.o. we had/implemented our
own JEE server (called T4) and our own profiler (called P4). I know those
tools very very well  Now I am not working at Trifork anymore, but I
still prefer using P4 as my profiling tool (at least for time-profiling -
for memory-profiling I do not always prefer the Trifork tool (called L4,
which is now a subpart of P4)). P4 is very configurable wrt exactly what you
want to profile, and a.o. therefore you can run with profiling without it
actually disturbes the application being profiled - thats nice.
Basically, in my last profiling, I just started my ES node with a P4 agent
inside, which was asked to only profile the RobinEngine.innerCreate method.
While the test was running I connected from my P4 viewer (just running on my
local Mac) to the P4 agent inside the ES node JVM (running on an external
server) and took a few snapshots. Then its just about using the viewer to
see where time is spent.
I can tell you a little bit more about how I did, if you want to do it
yourself, but Trifork is also very helpfull. P4 is a commercial product by
the way, but I believe you can have a one month trial.
Regards,
Paul