Hi Team,
I hope this message finds you well. I wanted to bring to your attention a small challenge we're currently facing with our Kibana dashboards. We are utilizing Kibana version 8.11.1 and have set up two indices, namely 'abc-config' and 'cloudinfra.' Each of these indices contains valuable information related to our applications and cloud infrastructure.
Here's a snippet from the 'abc-config' index:
      {
        "_index": "abc-config",
        "_id": "N_-1234567890",
        "_score": 1,
        "_source": {
          "activity": "App Config",
          "action": "Create",
          "timestamp": "2023-11-22T11:11:42.672Z",
          "description": " ESG Report Storage Account Update ",
          "MBVEnvironment": "ABC",
          "managed_by": "devops@abc.com",
          "resourceName": "abc-stoarage",
          "release": "ABC_0.44.5.0"
        }
And from the 'cloudinfra' index:
{
        "_index": "cloudinfra",
        "_id": "09GlEYwBT-0987654321",
        "_score": 1,
        "_source": {
          "additional_properties": {
            "systemData": {
              "createdBy": aabbcc-09876789,
              "createdByType": "Application",
              "createdAt": "2023-11-21T07:02:35.0623376Z",
              "lastModifiedBy": "qwer-123456",
              "lastModifiedByType": "Application",
              "lastModifiedAt": "2023-11-21T07:02:35.0623376Z"
            }
          },
          "id": "/subscriptions/1234567890/resourceGroups/abc-rg-backend/providers/Microsoft.ApiManagement/service/abc-apim",
          "name": "abc-apim",
          "type": "Microsoft.ApiManagement/service",
          "location": "westeurope",
          "extended_location": null,
          "tags": {
            "MBVEnvironment": "ABC"
          },
          "plan": null,
          "properties": null,
          "kind": null,
          "managed_by": null,
          "sku": {
            "additional_properties": {},
            "name": "Developer",
            "tier": null,
            "size": null,
            "family": null,
            "model": null,
            "capacity": 1
          },
          "identity": "{'additional_properties': {}, 'principal_id': None, 'tenant_id': None, 'type': 'None', 'user_assigned_identities': None}",
          "created_time": null,
          "changed_time": null,
          "provisioning_state": null
        }
      }
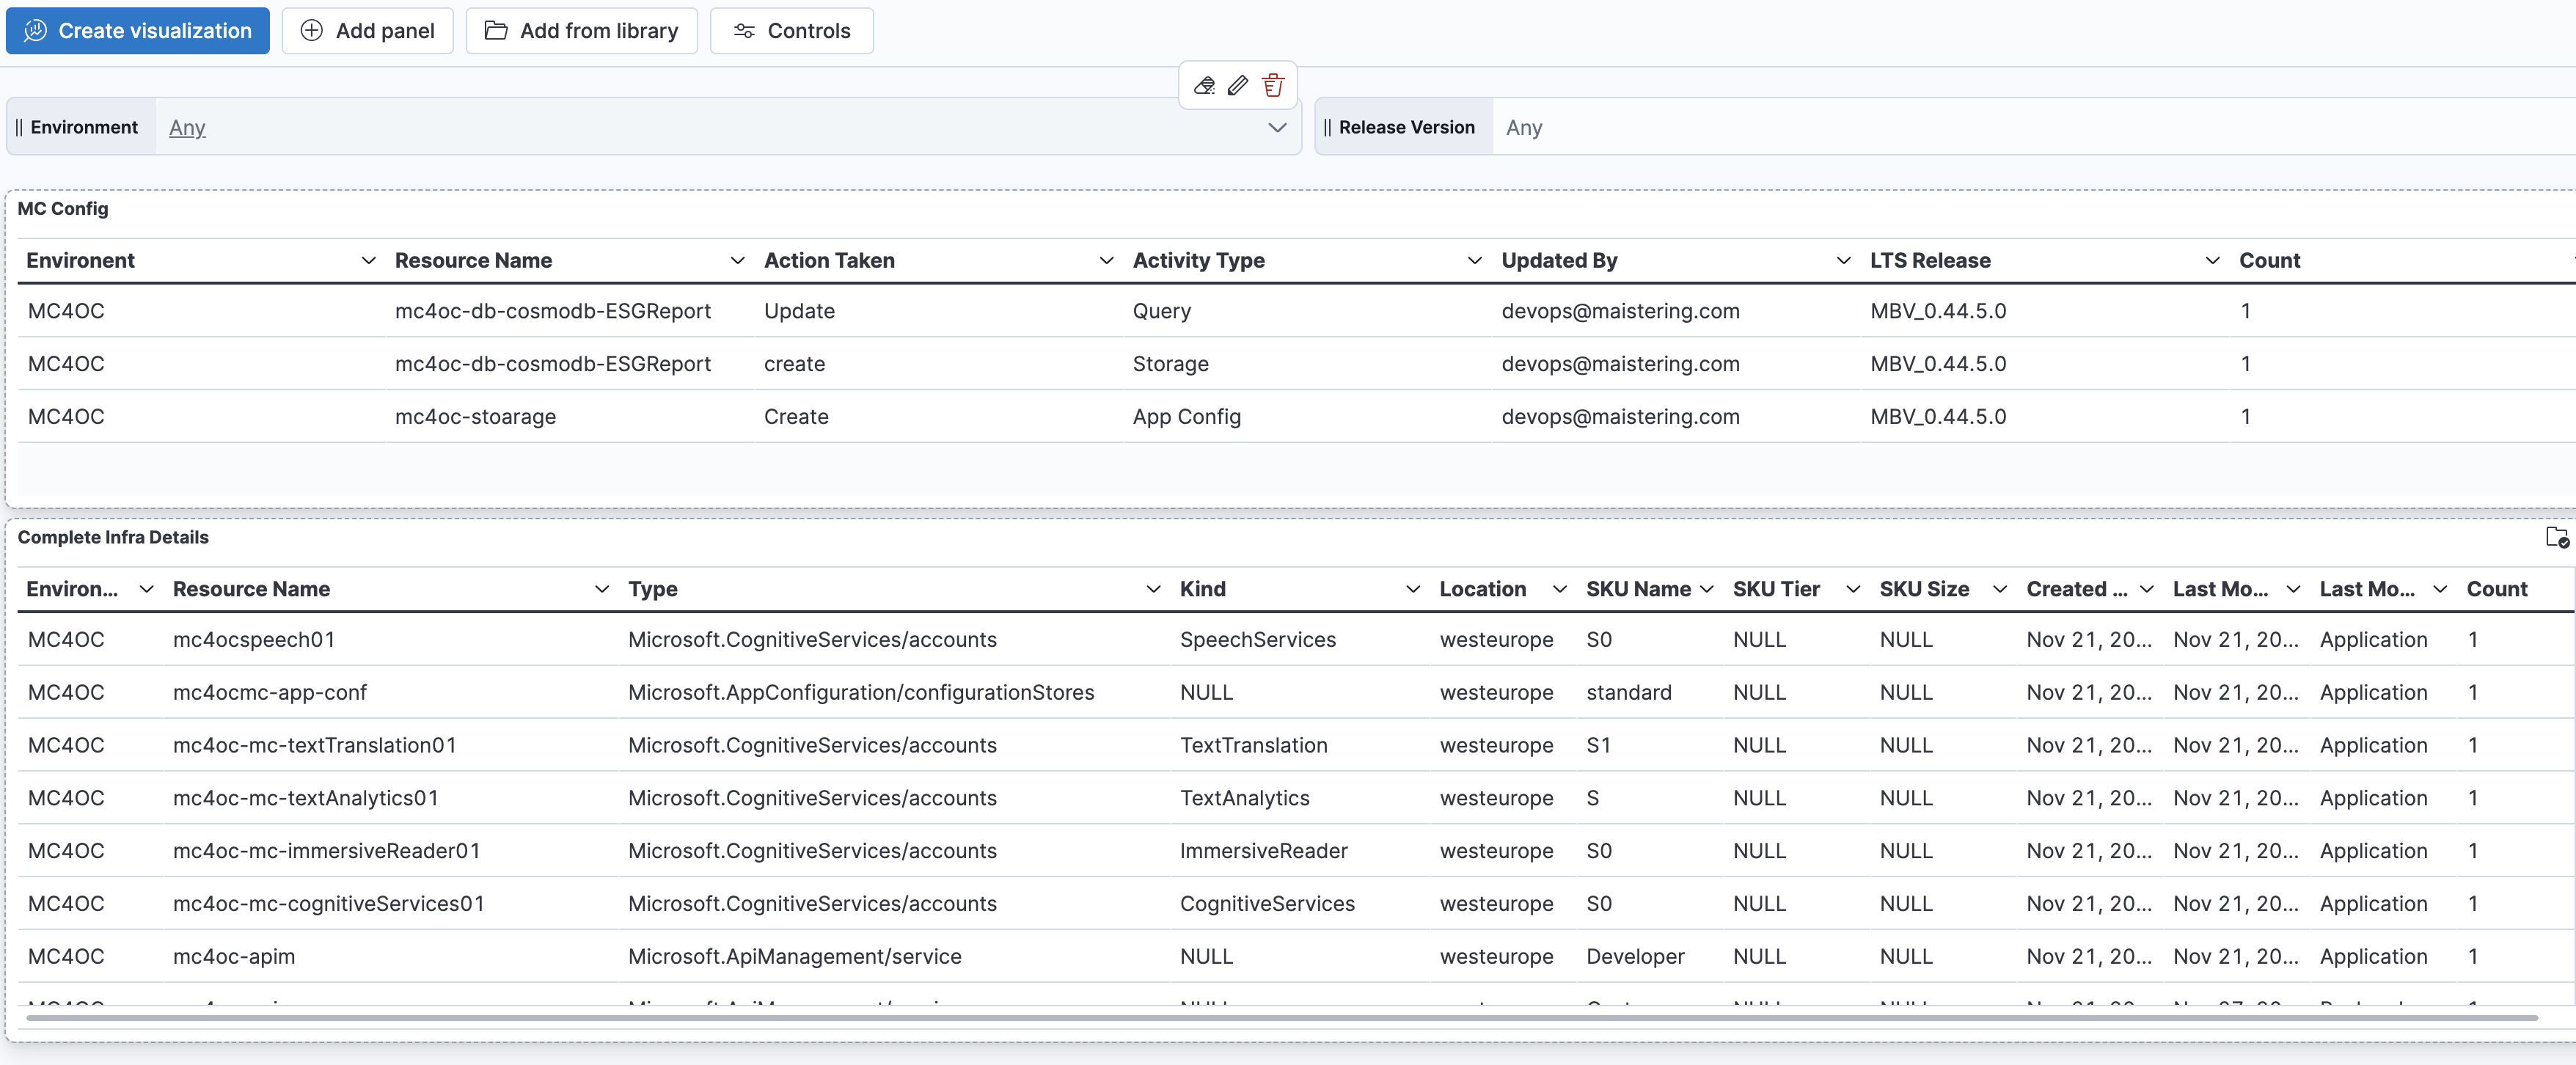
Currently, we have built two visuals in the form of tables for each index, and both are part of a Kibana dashboard. Additionally, a controls filter based on the 'MBVEnvironment' value from the 'abc-config' index has been added to facilitate filtering.
However, we've observed that when filtering through the 'MBVEnvironment' control, only the 'abc-config' table gets populated, while the 'cloudinfra' table shows no data. We believe that establishing a connection or mapping between these two visuals could address this issue.
We have around 15-20 documents for each index, and 'MBVEnvironment' is a common key among them. Could you provide guidance on how we can better synchronize these visuals or establish a connection between the indices? Our goal is to ensure that when we filter using the 'MBVEnvironment' value, both tables display the relevant data.
Your assistance in resolving this matter would be highly appreciated.
Below is the Screenshot of the dashboard.