Multi Metric and Single Metric Results Differ for the Same Time Series

X-Pack version: 6.2.2

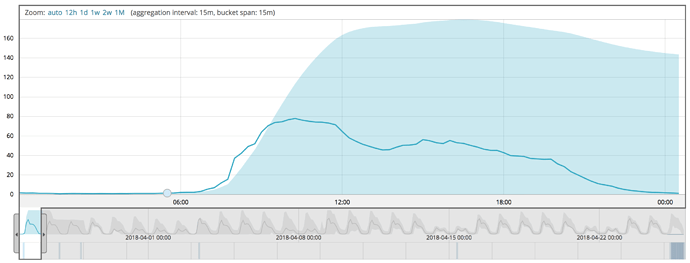
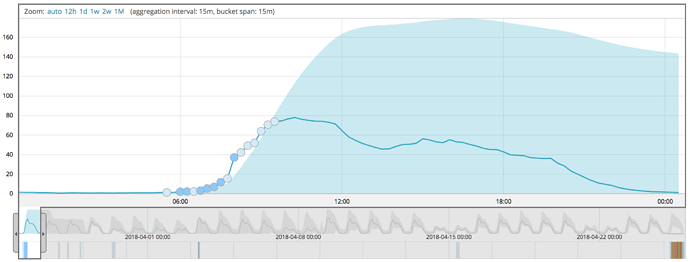
The problem I'm facing is that the number of detected anomalies and the severity level of detected anomalies defer between a single metric job and a multi metric job. Have a look at the screenshots to get an impression. In my examples I'm comparing one specific time series in the multi metric job with a single metric job on this time series. The documentation says that a multi metric job can be seen as many single metric jobs [0]. That implies that they produce the same model and the same anomalies for one specific time series. I activated the model bounds for the multi metric job to compare both models and they look exactly the same for both cases, which is good so far. I don't understand why the number of anomalies defer and why the anomaly severity is different between both job types for this specific time series.

Workaround attempts:
I varied the following parameters without any relevant effect
time window of the job
influencers (with and without)

Questions:

  • Why is it possible that the graph can exceed the model bounds without producing anomalies? (see Screenshots 1 and 2)
  • Why is the severity level of the anomalies in screenshot 3 and 4 different?
  • Is there an undocumented dependency in a multi metric job between the different time series?

References:
[0] https://www.elastic.co/guide/en/x-pack/current/ml-gs-multi-jobs.html#ml-gs-multi-jobs

Screenshots:
Multi Metric Start of Model Creation


Single Metric Start of Model Creation

Multi Metric Anomaly

Single Metric Anomaly

Unfortunately I wasn't able to attach the job JSON files to the post, because of a length limit. Here they are:

Multi Metric Job
{
"job_id": "multi-metric-job",
"job_type": "anomaly_detector",
"job_version": "6.2.2",
"description": "Multi Metric 26.03-26.04.2018",
"create_time": 1525780885973,
"finished_time": 1525792690819,
"established_model_memory": 277710372,
"analysis_config": {
"bucket_span": "15m",
"detectors": [
{
"detector_description": "mean(value)",
"function": "mean",
"field_name": "value",
"partition_field_name": "ts_id",
"rules": [],
"detector_index": 0
}
],
"influencers": [
"ts_id",
"criterion1",
"instance_id",
"location_id"
]
},
"analysis_limits": {
"model_memory_limit": "4000mb"
},
"data_description": {
"time_field": "@timestamp",
"time_format": "epoch_ms"
},
"model_plot_config": {
"enabled": true
},
"model_snapshot_retention_days": 1,
"model_snapshot_id": "1525792575",
"results_index_name": "shared",
"data_counts": {
"job_id": "multi-metric-job",
"processed_record_count": 33893524,
"processed_field_count": 168077852,
"input_bytes": 6138624671,
"input_field_count": 168077852,
"invalid_date_count": 0,
"missing_field_count": 1389768,
"out_of_order_timestamp_count": 0,
"empty_bucket_count": 0,
"sparse_bucket_count": 0,
"bucket_count": 2976,
"earliest_record_timestamp": 1522015200000,
"latest_record_timestamp": 1524693600000,
"last_data_time": 1525792572635,
"input_record_count": 33893524
},
"model_size_stats": {
"job_id": "multi-metric-job",
"result_type": "model_size_stats",
"model_bytes": 277710372,
"total_by_field_count": 3970,
"total_over_field_count": 0,
"total_partition_field_count": 3969,
"bucket_allocation_failures_count": 0,
"memory_status": "ok",
"log_time": 1525792575000,
"timestamp": 1524692700000
},
"datafeed_config": {
"datafeed_id": "datafeed-multi-metric-job",
"job_id": "multi-metric-job",
"query_delay": "98542ms",
"indices": [
"rest-"
],
"types": [],
"query": {
"bool": {
"must": [
{
"query_string": {
"query": "
",
"fields": [],
"type": "best_fields",
"default_operator": "or",
"max_determinized_states": 10000,
"enable_position_increments": true,
"fuzziness": "AUTO",
"fuzzy_prefix_length": 0,
"fuzzy_max_expansions": 50,
"phrase_slop": 0,
"analyze_wildcard": true,
"escape": false,
"auto_generate_synonyms_phrase_query": true,
"fuzzy_transpositions": true,
"boost": 1
}
},
{
"match_phrase": {
"application_type_id": {
"query": "field-c",
"slop": 0,
"boost": 1
}
}
},
{
"bool": {
"should": [
{
"match_phrase": {
"curve_id": {
"query": "field-a",
"slop": 0,
"boost": 1
}
}
},
{
"match_phrase": {
"curve_id": {
"query": "field-b",
"slop": 0,
"boost": 1
}
}
}
],
"adjust_pure_negative": true,
"minimum_should_match": "1",
"boost": 1
}
}
],
"adjust_pure_negative": true,
"boost": 1
}
},
"scroll_size": 1000,
"chunking_config": {
"mode": "auto"
},
"state": "stopped"
},
"state": "closed"
}

Single Metric Job
{
"job_id": "single-metric-job",
"job_type": "anomaly_detector",
"job_version": "6.2.2",
"description": "Single Metric 26.03. - 26.04.2018",
"create_time": 1525781363830,
"finished_time": 1525781371280,
"established_model_memory": 65024,
"analysis_config": {
"bucket_span": "15m",
"summary_count_field_name": "doc_count",
"detectors": [
{
"detector_description": "mean(value)",
"function": "mean",
"field_name": "value",
"rules": [],
"detector_index": 0
}
],
"influencers": []
},
"analysis_limits": {
"model_memory_limit": "10mb"
},
"data_description": {
"time_field": "@timestamp",
"time_format": "epoch_ms"
},
"model_plot_config": {
"enabled": true
},
"model_snapshot_retention_days": 1,
"model_snapshot_id": "1525781370",
"results_index_name": "shared",
"data_counts": {
"job_id": "single-metric-job",
"processed_record_count": 8928,
"processed_field_count": 17856,
"input_bytes": 611262,
"input_field_count": 17856,
"invalid_date_count": 0,
"missing_field_count": 0,
"out_of_order_timestamp_count": 0,
"empty_bucket_count": 0,
"sparse_bucket_count": 0,
"bucket_count": 2975,
"earliest_record_timestamp": 1522015200000,
"latest_record_timestamp": 1524693300000,
"last_data_time": 1525781368135,
"input_record_count": 8928
},
"model_size_stats": {
"job_id": "single-metric-job",
"result_type": "model_size_stats",
"model_bytes": 65024,
"total_by_field_count": 3,
"total_over_field_count": 0,
"total_partition_field_count": 2,
"bucket_allocation_failures_count": 0,
"memory_status": "ok",
"log_time": 1525781370000,
"timestamp": 1524691800000
},
"datafeed_config": {
"datafeed_id": "datafeed-single-metric-job",
"job_id": "single-metric-job",
"query_delay": "74694ms",
"indices": [
"rest-"
],
"types": [],
"query": {
"bool": {
"must": [
{
"query_string": {
"query": "
",
"fields": [],
"type": "best_fields",
"default_operator": "or",
"max_determinized_states": 10000,
"enable_position_increments": true,
"fuzziness": "AUTO",
"fuzzy_prefix_length": 0,
"fuzzy_max_expansions": 50,
"phrase_slop": 0,
"analyze_wildcard": true,
"escape": false,
"auto_generate_synonyms_phrase_query": true,
"fuzzy_transpositions": true,
"boost": 1
}
},
{
"match_phrase": {
"application_type_id": {
"query": "field-c",
"slop": 0,
"boost": 1
}
}
},
{
"bool": {
"should": [
{
"match_phrase": {
"curve_id": {
"query": "field-b",
"slop": 0,
"boost": 1
}
}
},
{
"match_phrase": {
"curve_id": {
"query": "field-a",
"slop": 0,
"boost": 1
}
}
}
],
"adjust_pure_negative": true,
"minimum_should_match": "1",
"boost": 1
}
},
{
"match_phrase": {
"ts_id": {
"query": "id-of-the-time-series",
"slop": 0,
"boost": 1
}
}
}
],
"adjust_pure_negative": true,
"boost": 1
}
},
"aggregations": {
"buckets": {
"date_histogram": {
"field": "@timestamp",
"interval": 90000,
"offset": 0,
"order": {
"_key": "asc"
},
"keyed": false,
"min_doc_count": 0
},
"aggregations": {
"value": {
"avg": {
"field": "value"
}
},
"@timestamp": {
"max": {
"field": "@timestamp"
}
}
}
}
},
"scroll_size": 1000,
"chunking_config": {
"mode": "manual",
"time_span": "90000000ms"
},
"state": "stopped"
},
"state": "closed"
}
After some further investigation I discovered another detail. When I start a multi metric job only containing a single time series it produces exactly the same results as the single metric job. When adding additional time series to the job the severity of the resulting anomalies significantly drops. Hopefully this helps debugging this.

  • Why is the severity level of the anomalies in screenshot 3 and 4 different?

The multi-series behaviour you are seeing is expected, and a result of the normalisation of anomaly scores across series.

The raw probabilities should be the same in both cases, but the derived 'anomaly score' is an overall rate-limited score for the job. Hence, if there are more significant anomalies in other series that the one you show, the score for the series you present will be lower than if it was run as a single series.

This normalisation is useful when dealing with large numbers of series, as it ranks and significantly reduces the total number of anomalies, but can lead to situations where sone anomaly scores are lowered.

We are currently working on improving these scores in certain situations. If you are happy to share the anonymized multiseries dataset with us, we can show you what the results would look like with the latest dev versions + would be good to get your feedback.

  • Why is it possible that the graph can exceed the model bounds without producing anomalies? (see Screenshots 1 and 2):

The model bounds are only a simple visual representation of our models and can not display the full expressiveness of the models. Also, due to normalisation the bounds on probability are different to the anomaly score.

Ah, then I think that the sentence "Conceptually, you can think of this as running many independent single metric jobs." from the referenced documentation page is a little bit misleading. Thanks for clarification.

However, is it maybe possible to do the normalization "per timeseries" instead of "per job" within a multi-metric-job?

P.S. Is the latest dev version publicly available to play around with it?

Hi Kaihil,

No, the latest dev version isn't available yet. Yes, we are also looking to allow the user to invoke normalization "per series" like you mention (or some amount of control over it) - hopefully within the next few minor releases.

Stay tuned.