My index loses data every 30 days

I use Elasticsearch and Kibana, I submit my data with the bulk API in vb.net program.
I did not make any special configuration in elastic search.
here is the content of the file elasticsearch.yml :

bootstrap.memory_lock: false
cluster.name: Mycluster
http.port: 9200
network.host: 0.0.0.0.0.0
node.data: true
node.ingest: true
node.master: true
node.max_local_storage_nodes: 1
node.name: MyNode
path.data: F:\Elasticsearch\data
path.logs: F:\Elasticsearch\logs
transport.tcp.port: 9300
xpack.license.self_generated.type: basic
xpack.security.enabled: false

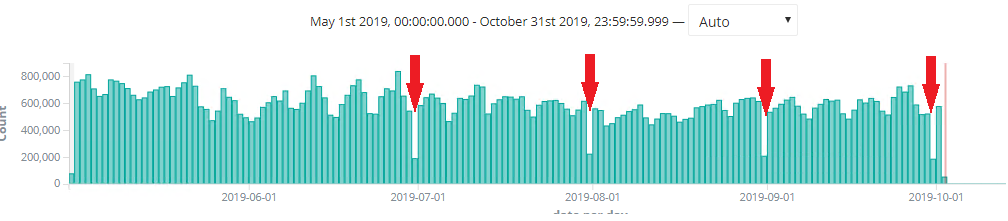
On average, I send 600 000 lines a day.
In recent months I have noticed that every month I have a loss of data periodically instead of 600 miles lines on average, I have :
30-06-2019 : 188,626
31-07-2019 : 221,839
31-08-2019 : 206,808
30-09-2019 : 184,473
as shown in this screenshot

Do you have an explanation for this phenomenon?
Regards,
Lotfi.

Do you analyse each bulk response to verify there were no errors and retry if there are? What version of Elasticsearch are you using? How large is your cluster and what does your Elasticsearch.yml file look like?

Hello Christian_Dahlqvist,
Thank you for your reply.
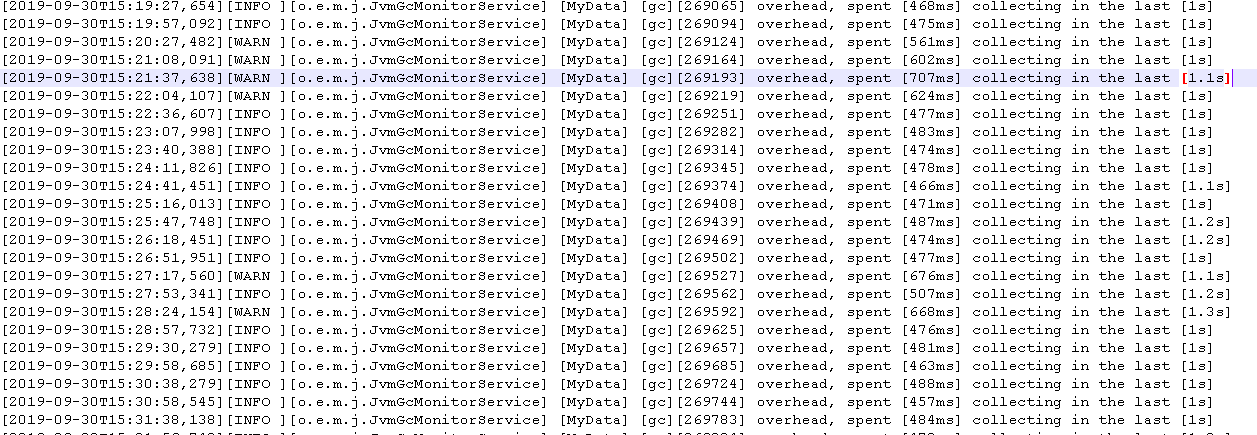
1- Yes I analyzed the bulk answers, no problem, the answer is like:
http://localhost:9200//_bulk
{"took":380, "errors":false,

2- I use version 6.5.1 of Elasticsearch

3- Currently I have 242 GB of data

4- elasticsearch.yml :

bootstrap.memory_lock: false
cluster.name: Mycluster
http.port: 9200
network.host: 0.0.0.0.0.0
node.data: true
node.ingest: true
node.master: true
node.max_local_storage_nodes: 1
node.name: MyNode
path.data: F:\Elasticsearch\data
path.logs: F:\Elasticsearch\logs
transport.tcp.port: 9300
xpack.license.self_generated.type: basic
xpack.security.enabled: false

5- I have a data loss every end of the month
30-06-2019
31-07-2019
31-08-2019
30-09-2019

What is the output of the _cluster/health API?

Are you using time-based indices, e.g. daily or monthly ones?

Is there anything in the the Elasticsearch logs around the times you highlighted?

Are you keeping statistics on how much you have indexed on the client side?

1- {
"cluster_name" : "Mycluster",
"status" : "yellow",
"timed_out" : false,
"number_of_nodes" : 1,
"number_of_data_nodes" : 1,
"active_primary_shards" : 17,
"active_shards" : 17,
"relocating_shards" : 0,
"initializing_shards" : 0,
"unassigned_shards" : 15,
"delayed_unassigned_shards" : 0,
"number_of_pending_tasks" : 0,
"number_of_in_flight_fetch" : 0,
"task_max_waiting_in_queue_millis" : 0,
"active_shards_percent_as_number" : 53.125
}
2- no time-based index is used, on the contrary, I keep my data for 3 years to make annual statistics

3- MyCluster-2019-09-30.log : the majority of the log file contains lines of this kind

4- Yes, as I have already said, my client program sends, on average 600 thousand lines per day, even in the days when there is a problem he sent the data with the same frequency .

Helo,
Any kind of help will be appreciable.
Regards,
Lotfi.

Are you checking the responses for your bulk requests in your application? The cluster might be rejecting requests due to load, or fail certain requests, which means that you will have to retry those. In particular are you checking whether errors : false in the bulk response?

This topic was automatically closed 28 days after the last reply. New replies are no longer allowed.