Hi,
I am using ELK 5.6.8 version. My ELK is running on RedHat machine. When I first run logstash.conf for MySQL database then I was able to see all the records of one table but now I am not able to see all records of one able. Kibana shows only last/latest row data. When I run logstash.conf file from the terminal on terminal I am able to see all the records of one table but on kibana only last records. When I used curl command as shown as below for elasticsearch to see MySQL index data then It shows only that last records which show on kibana.
By default, the _search API will show you only 10 hits if you don't specify otherwise. But in the response you should also be able to see the total number of hits that the search returned.
In your case it would be something like :9200/mysql/_stats
There you should be able to see the amount of docs of your index for example, and you could compare it with your expectations from logstash.
Another possible explanation for not having all the documents in elasticsearch could be this:
If you have ever deleted your index in elasticsearch maybe logstash hasn't sent all the information back (as the information was already sent). in such case I would recommend to force logstash to send again all the info.
Okay, let me rephrase the question. I have a config file to connect to a MySQL database and retrieve all the records from a table. The table only contains 15 records. However, only the latest record (only one record) is being pulled and displayed from the table .
What does your config file look like? Are you by any chance setting the document ID based on a parameter that does not exists, causing multiple updates of the same document? (You can check this by looking at the ID of the document you can see through Kibana.)
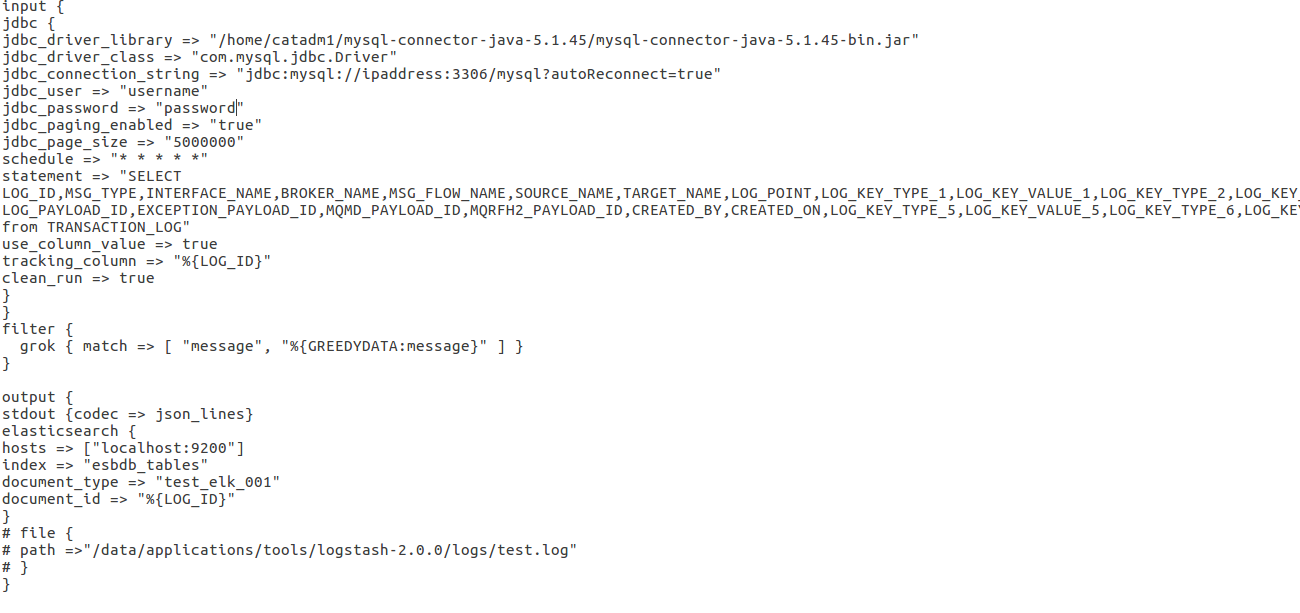
I am uploading my logstash.conf file.I am not able to understand the problem. When I run conf file first time then kibana was able to show all the 15 records but now when I run it, it shows only latest record.
Thank you.
As you can see there, all field names in the document are lower-cased, which is why document_id => "%{LOG_ID}" is not working, which causes the same document to be updated repeatedly. Change this to document_id => "%{log_id}" and it should work.
I have one more question. I have 4-5 conf file for different logs so every time I have to run logstash conf file for current log. I want to continuously run the conf file in the backend. I have tried to run from bin#./logstash -f logstash.conf and also tried to run from /etc/logstash/confd directory but not successful. I also tried nohup and crontab to run conf file in the backend but at a time only one file is running continuously.
Apache, Apache Lucene, Apache Hadoop, Hadoop, HDFS and the yellow elephant
logo are trademarks of the
Apache Software Foundation
in the United States and/or other countries.