Hi guys!
I need some help diagnosing my cluster performance.
Indexing is very slow and the whole cluster as well as Kibana is pretty unresponsive.
Here is my cluster:
We index about 1,5TB or 1.5 bn events every day.
We have multiple indices indexing at the same time with the most load originating from the logstash-* index. (38 Shards, no replicas)
Our cluster is split into two tiers.
What is the size of your documents? Do you use parent-child or nested documents? Do you perform any updates of existing data or just index new documents? Are you letting Elasticsearch assign the document id or providing one externally?
Maybe the codec should be set to something else? I assume that compression needs CPU. I believe that you have too many tasks that get scheduled back and forth.
Our data consists mainly of log files (webserver, firewall, proxy, ...). Is there a way i can measure the exact size of an average document?
No updates on existing data is performed.
Document IDs are set automatically.
CPU should be good enough. 64 to 128 Cores on every T1 machine.
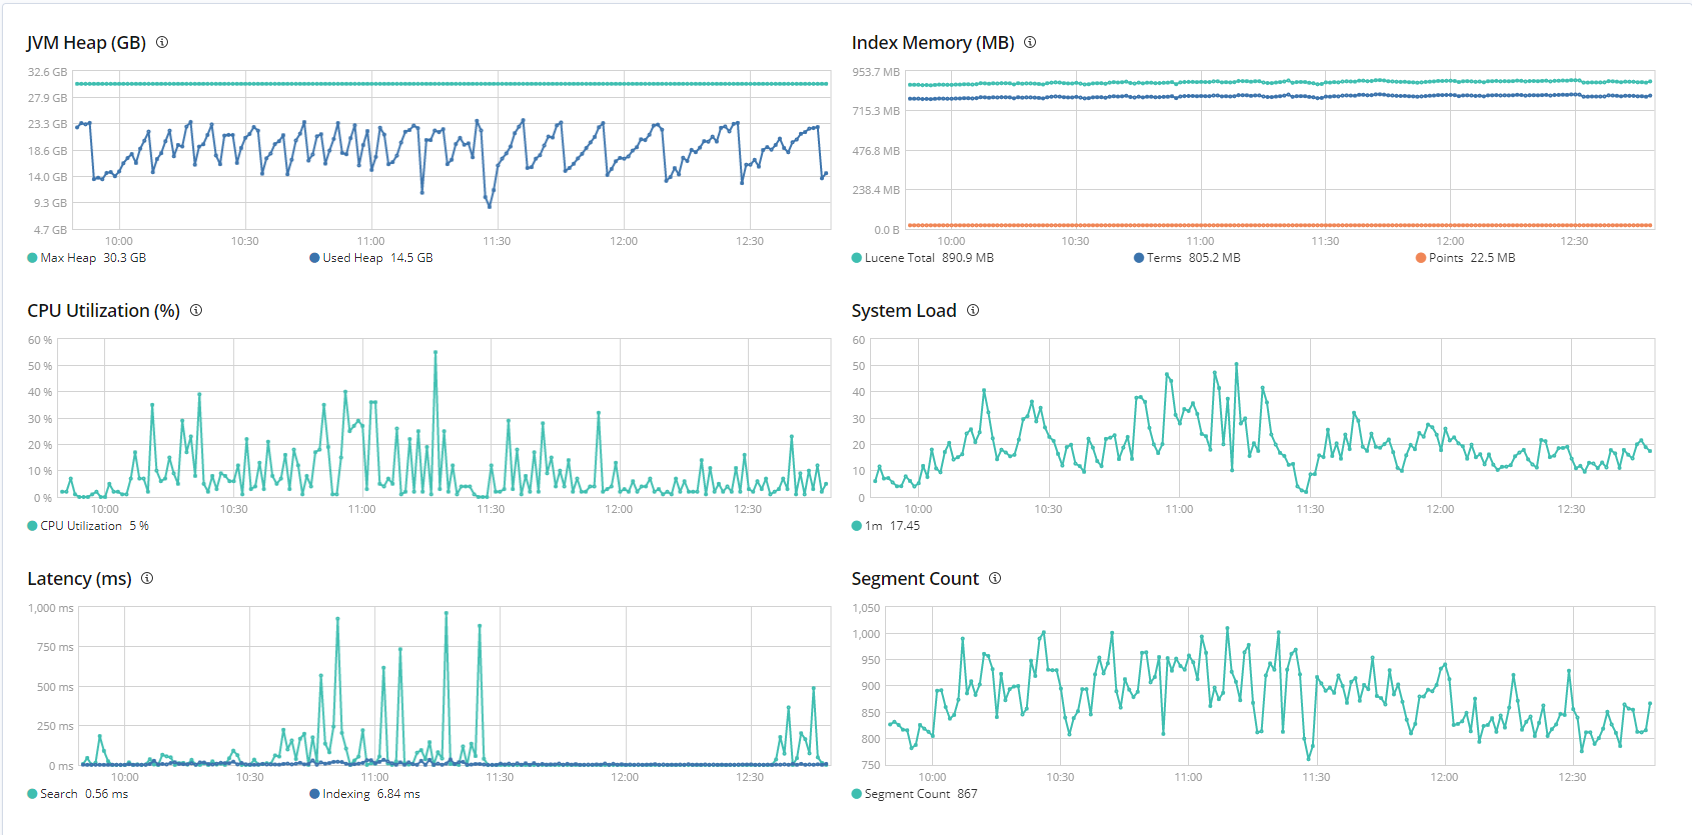
Here is a CPU Load graph:
Good catch! server-0258 and server-0259 are the "indexing" nodes. They get the requests from logstash.
They have slightly less CPUs (24) but I noticed server-0259 crashing several times a day without any notice in the log.
The server-258 is pretty busy with indexing and on top of that it also gets requests like data/read/search and admin/mappings/get
maybe you should take a look at the routing of these requests
Hmmm is it possible that this server also holds kibana?
In the config of kibana you could try to set up all of your nodes instead of just one. If you set up only one server it will act like a loadbalancer or proxy. If it is the overloaded ingest node kibana might be slow
server-0258 and server-0259 are the "outward-facing" nodes. They take care of Kibana, REST queries and connection to logstash.
This never caused issues, but some time ago the cluster started performing badly.
I suspect some old setting as the cause.
As the cluster has been upgraded from ES 0.* to now ES6.8.1 , it is inevitable that some deprecated setting will persist somewhere.
But in the next days I will probably try to move Kibana to another server and try again.
EDIT: @wifi
I just changed the ES-hosts in the Kibana configs. Performance did not change.
Kibana 6 takes ages to load the discover page when the logstash-* index is selected. I put the blame on some sort of mild mapping explosion in the logstash-* index.
I put a few of our fastest data nodes in there.
I also tried reducing the number of replicas on the .kibana index down to 5 from 44.
It did not change performance.
The bad performance you experience is only in Kibana right? Maybe you can get some clues if you use F12 - debugging Tools in the browser. The network monitor in Chrome could be interesting. BTW which Browser do you use?
It's definitely not just in Kibana.
I just installed a separate server for Kibana and it's decently fast. As soon as ES is involved it gets slow. I tried IE, Firefox, Chrome, Edge and Brave.
Also here's todays indexing queue:
(Different colors represent different nodes)
If I only could diagnose what is making these bulk queries so slow.
They got fast SSDs, big CPUs, and good heap.
EDIT:
Here is the graph after I changed the refresh interval from 30s to 180s:
Apache, Apache Lucene, Apache Hadoop, Hadoop, HDFS and the yellow elephant
logo are trademarks of the
Apache Software Foundation
in the United States and/or other countries.