I am new to Kibana and Elastic Search. I am trying to automate the process of checking whether the panels on the Kibana dashboard are populating data or not. In particular, I want to identify if they show "No Results Found" or show some type or error.
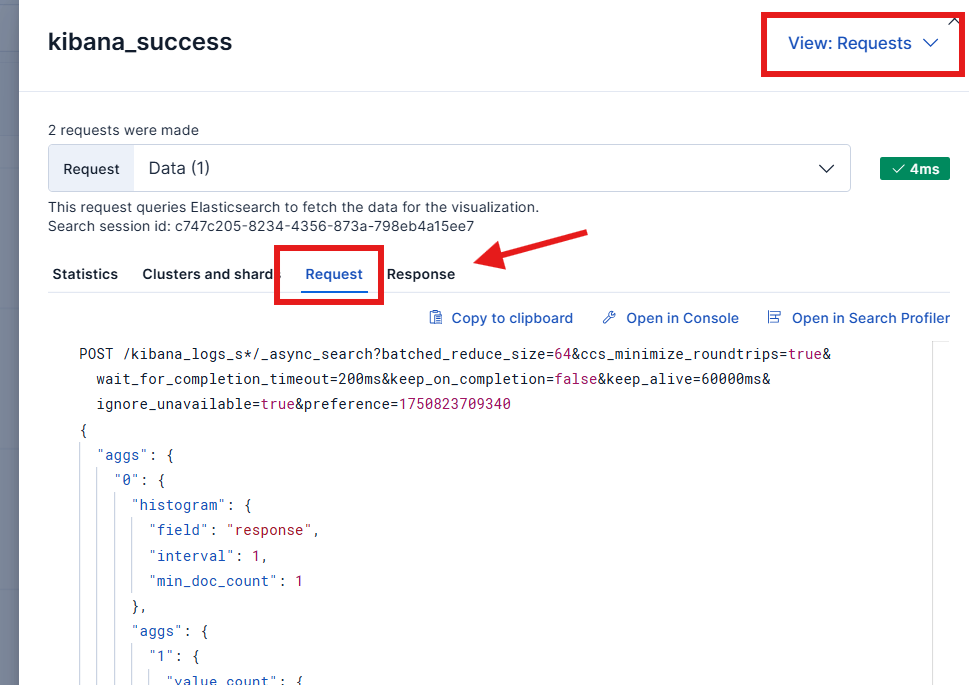
I was thinking of getting the query of each of the panels and then run the queries to check if they show more than 0 total hits or return some error. However, I am running into two problems: I am not sure how to extract these queries from the panels, and second some panels seem to be missing index patterns so running the queries seems hard.
If anyone can point me towards resources which I can use (such APIs), or suggest an alternative approach, that would be wonderful. Thank you!
Thank you for responding! I have been trying that, and while it works for most of the panels-- there are a few panels which don't have the "POST" line on the 'Request' subtab. Do you know the potential reasons for this? Some of these panels are populating and some of them are not.
I see that if the index is deleted from which this lens was created than i see this view. Maybe similar is your case & the index is not available anymore on the cluster?
Apache, Apache Lucene, Apache Hadoop, Hadoop, HDFS and the yellow elephant
logo are trademarks of the
Apache Software Foundation
in the United States and/or other countries.