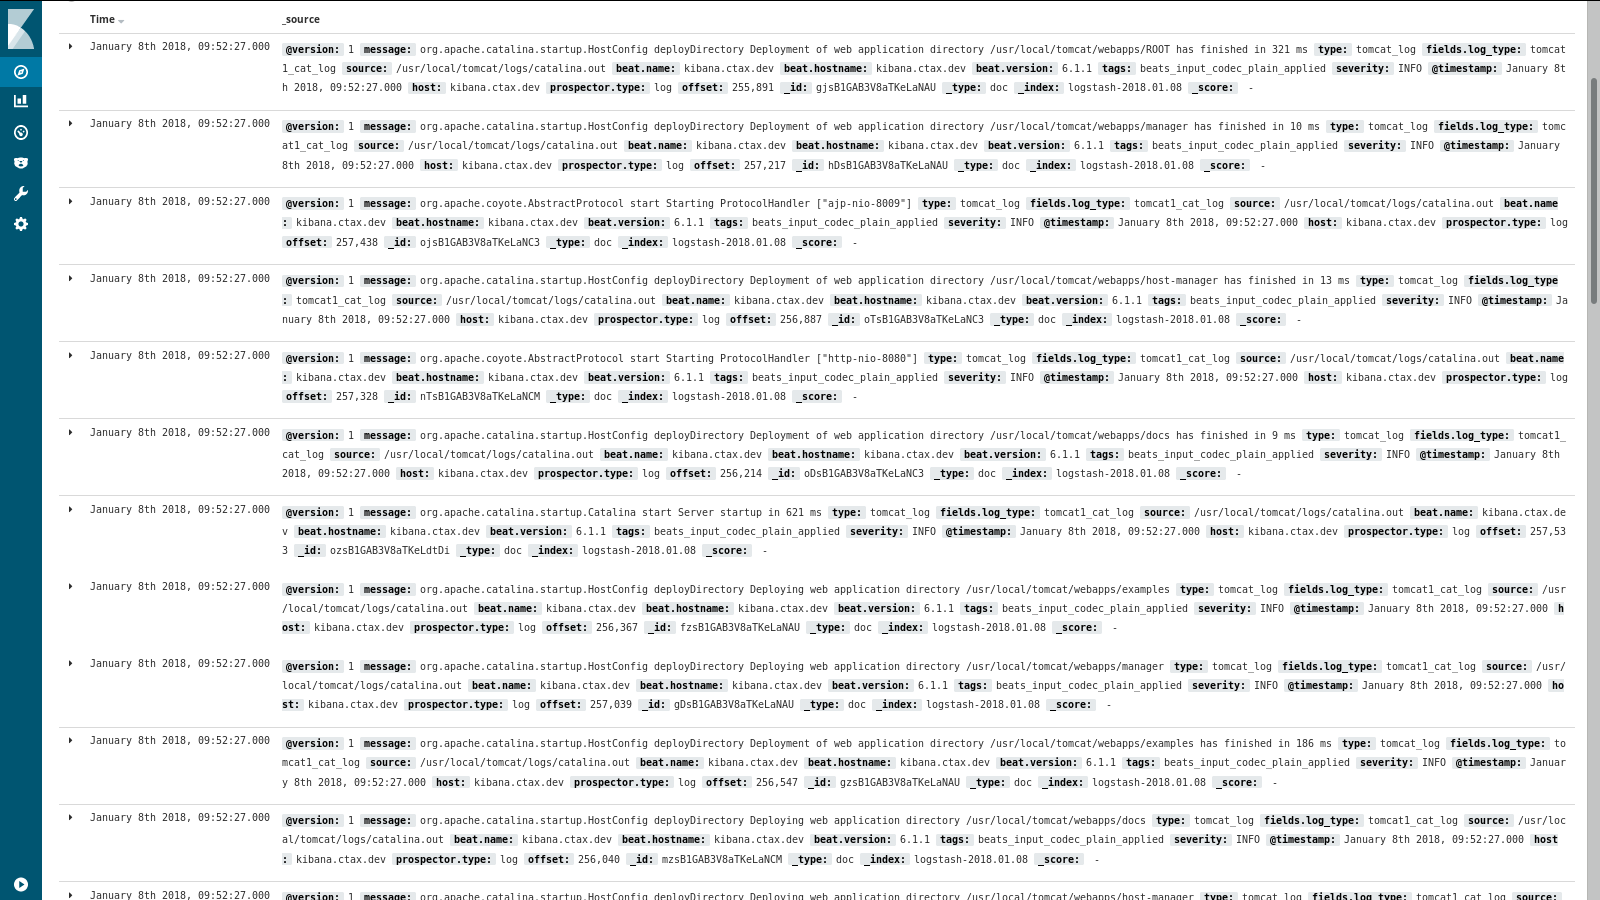
For tomcat configuration I have edited my filebeat.yml and logstash_tomcat.conf file as follows. Now Iam receiving the log file in my kibana interface. But while traversing through my log files, it was found that Iam getting "_grokparsefailure" which is not in the logs. Also in the same log series for another entry Iam getting "_dateparsefailure". Please find the required configuration files ie. filebeat.yml, logstash_tomcat.conf, JSON output and the error snippet passed mentioned along.
Please help me if my configurations are incorrect as Iam new to ELK+Filebeat.
############# Filebeat.yml ###############
filebeat.prospectors:
- type: log
enabled: true
paths:
- /usr/local/tomcat/logs/catalina.out
multiline.pattern: '^[[:space:]]'
multiline.pattern: '^[[:space:]]+|^Caused by:'
multiline.negate: false
multiline.match: after
document_type: tomcat_log
filebeat.config.modules:
path: ${path.config}/modules.d/*.yml
reload.enabled: false
setup.template.settings:
index.number_of_shards: 3
setup.kibana:
host: "192.168.3.226:5601"
output.logstash:
hosts: ["192.168.3.226:5044"]
##########################################
############# logstash_tomcat.conf #######
input {
beats {
type => "tomcat_log"
host => "192.168.3.226"
port => 5044
}
}
filter {
if [type] == "tomcat_log" {
grok {
patterns_dir => "/etc/logstash/patterns"
match => [ "message", "(?m)%{TIMESTAMP_ISO8601:timestamp} %{LOGLEVEL:severity} %{GREEDYDATA:message}" ]
overwrite => [ "message" ]
}
date {
match => [ "timestamp", "yyyy-MM-dd HH:mm:ss,SSS" ]
remove_field => [ "timestamp" ]
}
}
}
output {
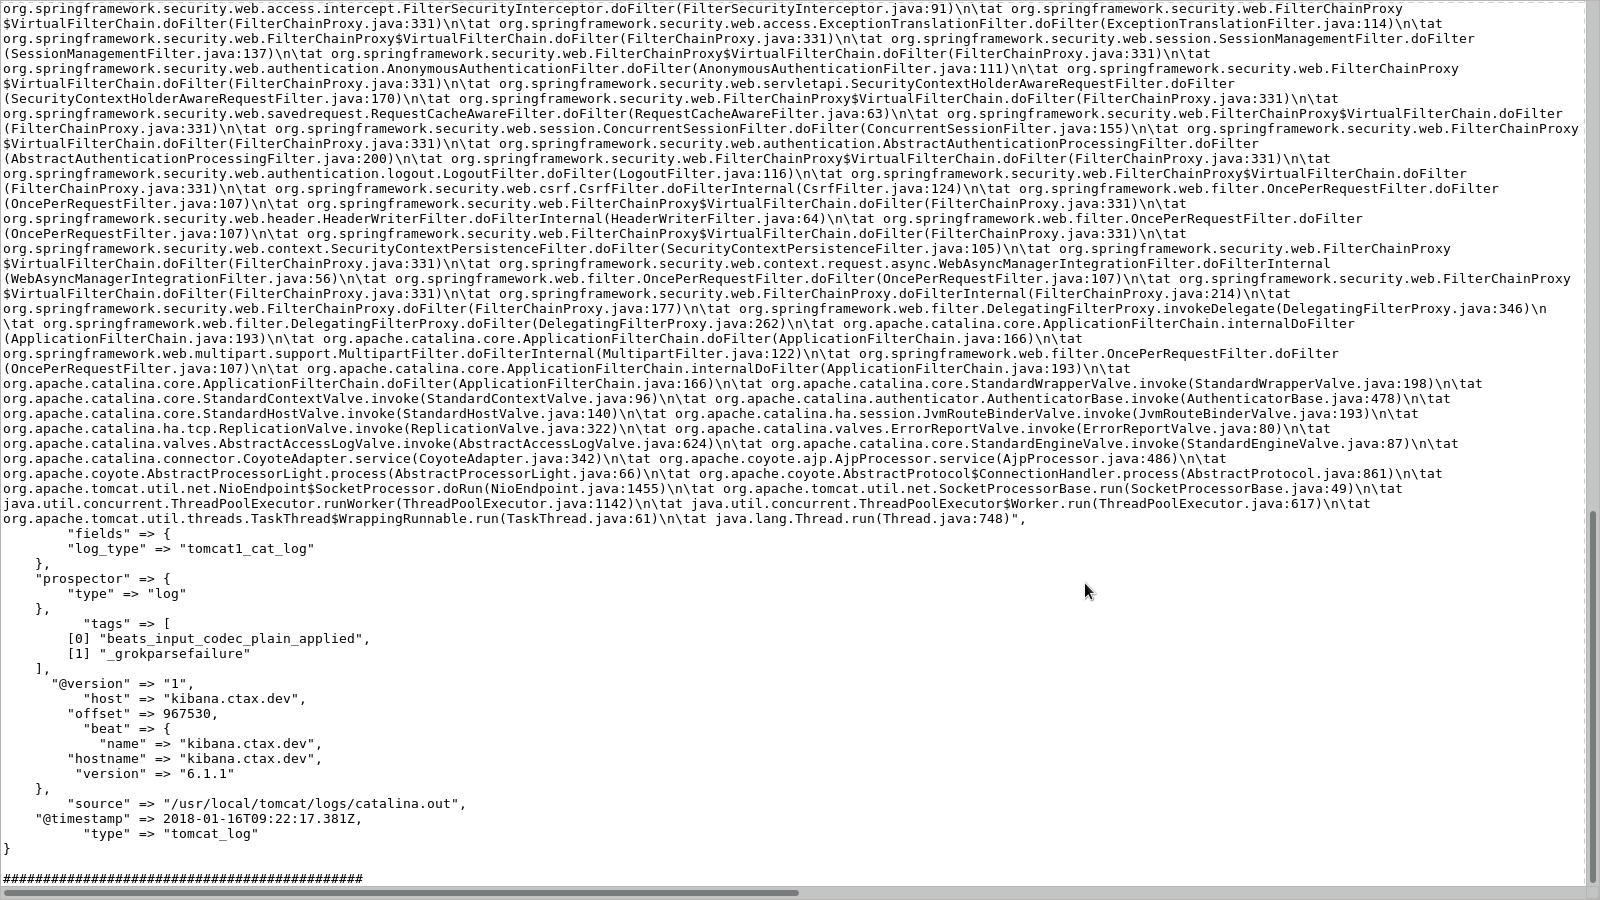
stdout { codec => rubydebug }
if [type] == "tomcat_log" {
elasticsearch {
manage_template => false
hosts => ["192.168.3.226:9200"]
}
}
}
##########################################
##################_grokparsefailure ######
{
"_index": "logstash-2018.01.01",
"_type": "doc",
"_id": "QnYPsWABQTfQ6qM1YymO",
"_version": 1,
"_score": null,
"_source": {
"source": "/usr/local/tomcat/logs/catalina.out",
"@version": "1",
"host": "kibana.ctax.dev",
"type": "tomcat_log",
"beat": {
"version": "6.1.1",
"name": "kibana.ctax.dev",
"hostname": "kibana.ctax.dev"
},
"offset": 29553175,
"message": "Hibernate: insert into gst_log.gstn_api_log (api_versn, encrpt_key, reqst_body, reqst_date, reqst_query_strng, reqst_type, reqst_url, reqst_year_month, rspns_sts, rspns_body, rspns_ek, rspns_hmac, reqst_rspns_id) VALUES (?, ?, ?::jsonb, ?::timestamptz, ?, ?, ?, ?::int, ?, ?::jsonb, ?, ?, ?::int)",
"prospector": {
"type": "log"
},
"tags": [
"beats_input_codec_plain_applied",
"_grokparsefailure"
],
"@timestamp": "2018-01-01T09:30:57.951Z"
},
"fields": {
"@timestamp": [
"2018-01-01T09:30:57.951Z"
]
},
"sort": [
1514799057951
]
}
##########################################
##################_dateparsefailure ######
{
"_index": "logstash-2018.01.01",
"_type": "doc",
"_id": "go8dsWABQTfQ6qM1d8us",
"_score": 1,
"_source": {
"source": "/usr/local/tomcat/logs/catalina.out",
"@version": "1",
"timestamp": "2017-10-13 16:00:00",
"beat": {
"version": "6.1.1",
"name": "kibana.ctax.dev",
"hostname": "kibana.ctax.dev"
},
"offset": 593030236,
"message": "TaskUtils$LoggingErrorHandler:95 - Unexpected error occurred in scheduled task.",
"type": "tomcat_log",
"host": "kibana.ctax.dev",
"severity": "ERROR",
"prospector": {
"type": "log"
},
"tags": [
"beats_input_codec_plain_applied",
"_dateparsefailure"
],
"@timestamp": "2018-01-01T09:46:25.418Z"
},
"fields": {
"@timestamp": [
"2018-01-01T09:46:25.418Z"
]
}
}
##########################################
############ Error-log snippet ###########
Hibernate: insert into gst_log.gstn_api_log (api_versn, encrpt_key, reqst_body, reqst_date, reqst_query_strng, reqst_type, reqst_url, reqst_year_month, rspns_sts, rspns_body, rspns_ek, rspns_hmac, reqst_rspns_id) VALUES (?, ?, ?::jsonb, ?::timestamptz, ?, ?, ?, ?::int, ?, ?::jsonb, ?, ?, ?::int)
2017-10-31 16:00:00 ERROR TaskUtils$LoggingErrorHandler:95 - Unexpected error occurred in scheduled task.
java.lang.Error: Unresolved compilation problem:
Unhandled exception type ParseException
    at nic.kerala.adsm.attendancesystem.configuration.SchedulerConfig.scheduleTaskUsingCronExpression(SchedulerConfig.java:49)
    at sun.reflect.NativeMethodAccessorImpl.invoke0(Native Method)
    at sun.reflect.NativeMethodAccessorImpl.invoke(NativeMethodAccessorImpl.java:62)
    at sun.reflect.DelegatingMethodAccessorImpl.invoke(DelegatingMethodAccessorImpl.java:43)
    at java.lang.reflect.Method.invoke(Method.java:498)
    at org.springframework.scheduling.support.ScheduledMethodRunnable.run(ScheduledMethodRunnable.java:65)
    at org.springframework.scheduling.support.DelegatingErrorHandlingRunnable.run(DelegatingErrorHandlingRunnable.java:54)
    at org.springframework.scheduling.concurrent.ReschedulingRunnable.run(ReschedulingRunnable.java:81)
    at java.util.concurrent.Executors$RunnableAdapter.call(Executors.java:511)
    at java.util.concurrent.FutureTask.run(FutureTask.java:266)
    at java.util.concurrent.ScheduledThreadPoolExecutor$ScheduledFutureTask.access$201(ScheduledThreadPoolExecutor.java:180)
    at java.util.concurrent.ScheduledThreadPoolExecutor$ScheduledFutureTask.run(ScheduledThreadPoolExecutor.java:293)
    at java.util.concurrent.ThreadPoolExecutor.runWorker(ThreadPoolExecutor.java:1142)
    at java.util.concurrent.ThreadPoolExecutor$Worker.run(ThreadPoolExecutor.java:617)
    at java.lang.Thread.run(Thread.java:748)
Hibernate: select nextval ('gst_log.gstn_api_log_reqst_rspns_id_seq')
Hibernate: insert into gst_log.gstn_api_log (api_versn, encrpt_key, reqst_body, reqst_date, reqst_query_strng, reqst_type, reqst_url, reqst_year_month, rspns_sts, rspns_body, rspns_ek, rspns_hmac, reqst_rspns_id) VALUES (?, ?, ?::jsonb, ?::timestamptz, ?, ?, ?, ?::int, ?, ?::jsonb, ?, ?, ?::int)
Hibernate: insert into gst_log.gstn_api_log (api_versn, encrpt_key, reqst_body, reqst_date, reqst_query_strng, reqst_type, reqst_url, reqst_year_month, rspns_sts, rspns_body, rspns_ek, rspns_hmac, reqst_rspns_id) VALUES (?, ?, ?::jsonb, ?::timestamptz, ?, ?, ?, ?::int, ?, ?::jsonb, ?, ?, ?::int)
##########################################