Hi ,
I am trying to create error dashboard for which firstly I have to create a visualization out of my Index pattern. I am not able to see all the elements of my xml when I am trying to filter out to create the visualization. Not sure why all fields are not visible/available. Kindly help me here and let me know if you require more information from my end.
I am able to extract the below xml when written the grok code and out of this xml I wanted to create a dashboard which is a stopper now.
2020 Jul 27 16:56:21:263 GMT +0200 BW.LogisticProcesses-2-LogisticProcesses-040101-1 Activity [Transport] EAI-04006 MSGID=tsCaw/h2YAHl8En/1Q-7eu3U6W2 Sending synchronous RV response
Subject: _INBOX.0A0A8001.5E969A7A38164.29506
<?xml version="1.0" encoding="UTF-8"?>
<ns0:PerformLogisticActivity.1 xmlns:ns0="http://xmlns.kpn.com/fixed/LogisticProcesses/Response/PerformLogisticActivity.1.xsd">
<ns1:CMH xmlns:ns1="http://xmlns.kpn.com/common/cdm/Base.xsd">
ns1:ID1687</ns1:ID>
ns1:NAMEPerformLogisticActivity</ns1:NAME>
ns1:MID1687.10</ns1:MID>
ns1:PARADIGMRESPONSE</ns1:PARADIGM>
ns1:OBJECTPerformLogisticActivity</ns1:OBJECT>
ns1:VERSION1.0</ns1:VERSION>
<ns1:FROM ns1:COMPONENT_ID="LogisticProcesses" ns1:COMPONENT_VERSION="4.1.1"/>
<ns1:TO ns1:DESTINATION="_INBOX.0A0A8001.5E969A7A38164.29506"/>
ns1:TRACKING
ns1:MESSAGE_IDtsCaw/h2YAHl8En/1Q-7eu3U6W2</ns1:MESSAGE_ID>
ns1:EXTERNAL_REF0762a483-b71a-4466-a21e-74682f6fe6c3</ns1:EXTERNAL_REF>
<ns1:ITEM ns1:APPINFO="LogisticProcesses" ns1:EVENT="PerformLogisticActivity" ns1:TIMESTAMP="1595861781255"/>
<ns1:ITEM xmlns:ns0="http://xmlns.kpn.com/fixed/LogisticProcesses/Request/PerformLogisticActivity.1.xsd" xmlns:ns1="http://xmlns.kpn.com/common/cdm/Base.xsd" ns1:APPINFO="GenericB2BGateway" ns1:EVENT="PerformLogisticActivity" ns1:TIMESTAMP="1595861693208"/>
</ns1:TRACKING>
<ns1:ATTRIBUTE xmlns:ns0="http://xmlns.kpn.com/fixed/LogisticProcesses/Request/PerformLogisticActivity.1.xsd" xmlns:ns1="http://xmlns.kpn.com/common/cdm/Base.xsd" ns1:NAME="SOURCE" ns1:VALUE="REVIVA"/>
<ns1:ATTRIBUTE xmlns:ns0="http://xmlns.kpn.com/fixed/LogisticProcesses/Request/PerformLogisticActivity.1.xsd" xmlns:ns1="http://xmlns.kpn.com/common/cdm/Base.xsd" ns1:NAME="DESTINATION" ns1:VALUE="Koninklijke PTT Nederland"/>
<ns1:ATTRIBUTE xmlns:ns0="http://xmlns.kpn.com/fixed/LogisticProcesses/Request/PerformLogisticActivity.1.xsd" xmlns:ns1="http://xmlns.kpn.com/common/cdm/Base.xsd" ns1:NAME="TRANSACTION_ID" ns1:VALUE="0762a483-b71a-4466-a21e-74682f6fe6c3"/>
</ns1:CMH>
<ns0:RESULTSTATUS xmlns:ns1="http://xmlns.kpn.com/common/cdm/ResultStatus.xsd" ns1:STATUS="41" ns1:ERROR_CODE="LP-ERR-001" ns1:ERROR_DESCRIPTION="One or more errors occurred and the order could not be processed. See the result_details for a full report."/>
<ns1:PerformLogisticActivityResponse1.0 xmlns:ns1="http://xmlns.kpn.com/EAI/fixed/0737_PerformLogisticActivity.1/1.0/Response">
<RESULT_DETAILS>
<RESULT_DETAIL>
Activity
PerformLogisticActivity
<STATUS_CODE>1</STATUS_CODE>
<ERROR_CODE>10120</ERROR_CODE>
<ERROR_DESCRIPTION>An RV timeout occured in Sending/Receiving sync response message</ERROR_DESCRIPTION>
</RESULT_DETAIL>
</RESULT_DETAILS>
</ns1:PerformLogisticActivityResponse1.0>
</ns0:PerformLogisticActivity.1>
Note that I will be making use of fields inside RESULT_DETAIL for my dashboard.
Thanks,
Dinesh Potey
hi @Dinesh_Potey,
I think this is really an "it depends" answer. When creating visualizations, not every field will show in all field-selection dropdowns. It depends on a number of factos.
- What is the visualization you are trying to build? What exactly is the configuration you are trying to set?
- What is the
_mapping of your index? Depending on the field-type, certain functionality will be available or not (e.g. analyzed fields cannot be used to aggregate). The XML-snippet is likely not all that relevant. What is relevant is how you actually ingested that document (so (2)).
Hi Thomas,
I am trying to create a error graph based on the fields of my xml . Similar index I created for other xml with same fields I can see in visualize , but I am not able to see in my particular index pattern. Not sure when same grok pattern is written and similar xml is extracted out , only 1 index shows me all fields whereas other doesn't.
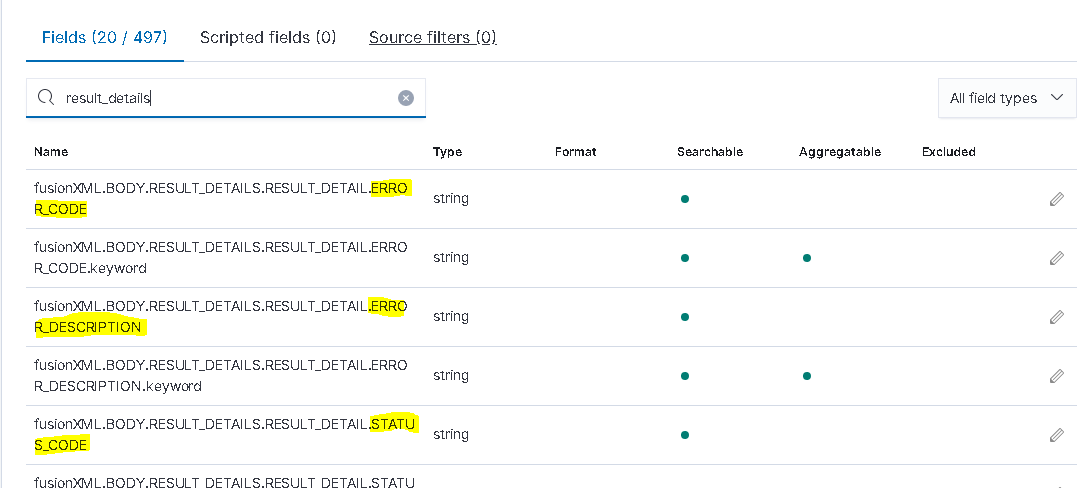
With grok pattern I shared earlier, I am able to see the index created under index pattern and index management on kibana. The problem is , under kibana--> saved objects -> [mm-eai-logisticprocesses] I don't see the required fields for only this index [mm-eai-logisticprocesses]. For another index( see below snippet) which has same data , I get all the required error fields. My requirement is to fetch below xml and all the fields in the xml.
.
2020 Jul 27 16:56:21:263 GMT +0200 BW.LogisticProcesses-2-LogisticProcesses-040101-1 Activity [Transport] EAI-04006 MSGID=tsCaw/h2YAHl8En/1Q-7eu3U6W2 Sending synchronous RV response
Subject: _INBOX.0A0A8001.5E969A7A38164.29506
<?xml version="1.0" encoding="UTF-8"?>
<ns0:PerformLogisticActivity.1 xmlns:ns0="http://xmlns.kpn.com/fixed/LogisticProcesses/Response/PerformLogisticActivity.1.xsd">
    <ns1:CMH xmlns:ns1="http://xmlns.kpn.com/common/cdm/Base.xsd">
        <ns1:ID>1687</ns1:ID>
        <ns1:NAME>PerformLogisticActivity</ns1:NAME>
        <ns1:MID>1687.10</ns1:MID>
        <ns1:PARADIGM>RESPONSE</ns1:PARADIGM>
        <ns1:OBJECT>PerformLogisticActivity</ns1:OBJECT>
        <ns1:VERSION>1.0</ns1:VERSION>
        <ns1:FROM ns1:COMPONENT_ID="LogisticProcesses" ns1:COMPONENT_VERSION="4.1.1"/>
        <ns1:TO ns1:DESTINATION="_INBOX.0A0A8001.5E969A7A38164.29506"/>
        <ns1:TRACKING>
            <ns1:MESSAGE_ID>tsCaw/h2YAHl8En/1Q-7eu3U6W2</ns1:MESSAGE_ID>
            <ns1:EXTERNAL_REF>0762a483-b71a-4466-a21e-74682f6fe6c3</ns1:EXTERNAL_REF>
            <ns1:ITEM ns1:APPINFO="LogisticProcesses" ns1:EVENT="PerformLogisticActivity" ns1:TIMESTAMP="1595861781255"/>
            <ns1:ITEM xmlns:ns0="http://xmlns.kpn.com/fixed/LogisticProcesses/Request/PerformLogisticActivity.1.xsd" xmlns:ns1="http://xmlns.kpn.com/common/cdm/Base.xsd" ns1:APPINFO="GenericB2BGateway" ns1:EVENT="PerformLogisticActivity" ns1:TIMESTAMP="1595861693208"/>
        </ns1:TRACKING>
        <ns1:ATTRIBUTE xmlns:ns0="http://xmlns.kpn.com/fixed/LogisticProcesses/Request/PerformLogisticActivity.1.xsd" xmlns:ns1="http://xmlns.kpn.com/common/cdm/Base.xsd" ns1:NAME="SOURCE" ns1:VALUE="REVIVA"/>
        <ns1:ATTRIBUTE xmlns:ns0="http://xmlns.kpn.com/fixed/LogisticProcesses/Request/PerformLogisticActivity.1.xsd" xmlns:ns1="http://xmlns.kpn.com/common/cdm/Base.xsd" ns1:NAME="DESTINATION" ns1:VALUE="Koninklijke PTT Nederland"/>
        <ns1:ATTRIBUTE xmlns:ns0="http://xmlns.kpn.com/fixed/LogisticProcesses/Request/PerformLogisticActivity.1.xsd" xmlns:ns1="http://xmlns.kpn.com/common/cdm/Base.xsd" ns1:NAME="TRANSACTION_ID" ns1:VALUE="0762a483-b71a-4466-a21e-74682f6fe6c3"/>
    </ns1:CMH>
    <ns0:RESULTSTATUS xmlns:ns1="http://xmlns.kpn.com/common/cdm/ResultStatus.xsd" ns1:STATUS="41" ns1:ERROR_CODE="LP-ERR-001" ns1:ERROR_DESCRIPTION="One or more errors occurred and the order could not be processed. See the result_details for a full report."/>
    <ns1:PerformLogisticActivityResponse1.0 xmlns:ns1="http://xmlns.kpn.com/EAI/fixed/0737_PerformLogisticActivity.1/1.0/Response">
        <BODY>
            <RESULT_DETAILS>
                <RESULT_DETAIL>
                    <TYPE>Activity</TYPE>
                    <STEP>PerformLogisticActivity</STEP>
                    <STATUS_CODE>1</STATUS_CODE>
                    <ERROR_CODE>10120</ERROR_CODE>
                    <ERROR_DESCRIPTION>An RV timeout occured in Sending/Receiving  sync response message</ERROR_DESCRIPTION>
                </RESULT_DETAIL>
            </RESULT_DETAILS>
        </BODY>
    </ns1:PerformLogisticActivityResponse1.0>
</ns0:PerformLogisticActivity.1>
hi @Dinesh_Potey
this seems more of an ingest issue. You might want to double check if your data is indexed correctly first, before troubleshooting in Kibana. Verify the Elasticsearch-mapping of your index and check if all desired fields are in there (https://www.elastic.co/guide/en/elasticsearch/reference/current/mapping.html). (myindex/_mapping) The compare that to an actual document in your index (myindex/_search). I'd expect something is missing there.