I have tested with 6.3 + Java 10 in docker and also 6.2.4 + Java 8 in docker.
Behavior is same.
With the same query, ES 6.x latencies are 10x slower than 5.6.4. I have observed similar behavior with few other scripted queries also.
What I have observed is that the heap usage is same in both, latency when there is no concurrency is same.
When there is concurrency or continuous load even with 1 concurrency, ES 6.x CPU usage is very high(100% across all 4 cores).
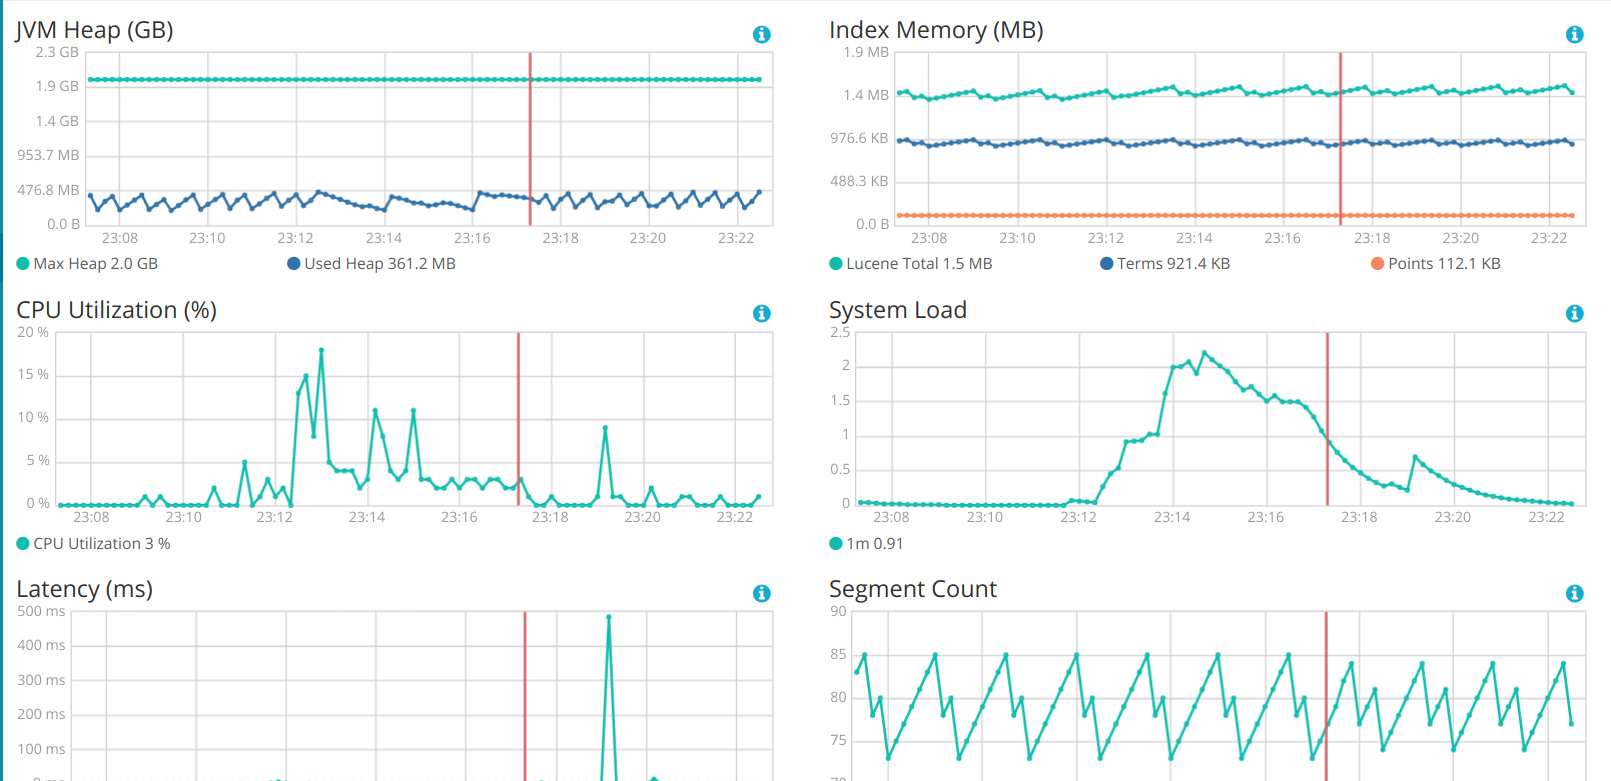
The only metric I see different is the young GC count which is very high in ES 6.x, which might explain the high CPU usage? Please refer the attached images.
Is ES 6.x somehow less performant? it's hard to believe. So, is it something to do wth any default setting that has changed, that I need to tune?
Data - 1.1 M docs
4 GB, 4 core with 2 GB set to heap
ES query used to load test
hard to tell what is going on based on your description. Is there a chance that you can (privately) share an anonymised version of the document corpus so we can have a closer look?
The whole dataset (incl. mapping) would be great so we can reproduce your scenario. It would be great if you could share a download link via a private message.
It would also be good if you could share the script with the actual field names from the data set because we suspect that the difference might have to do with doc values and then it is important again that we access the same fields that you do.
Does that mean that the performance of doc_values depends on the length of field names?
no, I was not referring to the length of the field names but it might make a difference whether you access a field that has 5 distinct values or 5 million distinct values.
I created a benchmark based on the data that you have provided. It first indexes all data and then it runs your Painless query with four clients concurrently at a rate of five operations per second. I ran that against the Docker images for 5.6.4 and 6.2.4 with a heap size of 2GB on our nightly benchmarking hardware.
For that scenario I get the following results:
Metric
Task
ES 5.6.4
ES 6.2.4
Diff
Unit
Total Young Gen GC
2.974
2.431
-0.543
s
Total Old Gen GC
0.211
0.181
-0.03
s
Store size
0.514003
0.514522
0.00052
GB
50th percentile latency
painless
269.538
257.694
-11.8438
ms
90th percentile latency
painless
302.744
290.283
-12.4613
ms
99th percentile latency
painless
322.716
304.926
-17.7899
ms
100th percentile latency
painless
367.526
317.751
-49.7747
ms
error rate
painless
0
0
0
%
It could be the case that the benchmark is still not capturing your scenario or something else is going on in your environment. I'll send you a link to the benchmark in a PM so you can try it yourself and see whether you see a difference.
Apache, Apache Lucene, Apache Hadoop, Hadoop, HDFS and the yellow elephant
logo are trademarks of the
Apache Software Foundation
in the United States and/or other countries.