I'm running a set of very simple elasticsearch instances as part of a
graylog2 deployment. Each set has a single elasticsearch node (its own
cluster). I recently upgraded these sets to 1.34 as part of an upgrade to
the graylog2 server, and I immediately noticed some periodic high loads on
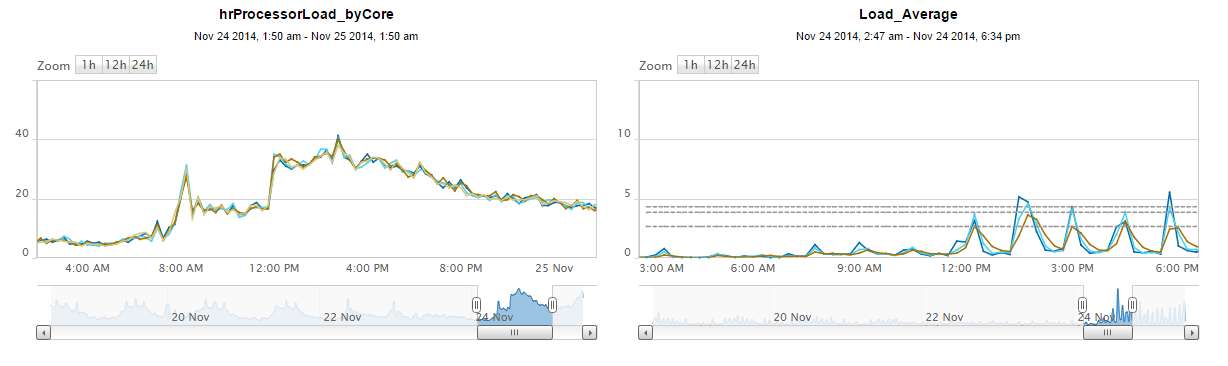
the machines involved; here's a cpu and load graph from one of the upgrades:
https://lh5.googleusercontent.com/-VpRVGkOajg8/VHzUsvLe1NI/AAAAAAAABmk/PIXlnNboHwc/s1600/cpuandload.png
The upgrade occurred at ~12pm (you can see the spike on the ProcessorLoad
graph). There are now periods of fairly high load, it goes up to ~5 on
this graph, though when watching the machine through htop or the like, 5
minute load tops out at about 8 at the start of any given spike. I've
determined that the machine is not bound by cpu, memory, or I/O during
these events, and I've also confirmed that there is no GC thrashing.
I don't see anything in the logs of either elasticsearch or graylog2 that
line up with the spikes.
When the spike is going on, all 5 threads from the management pool tend to
be active (learned this by comparing the running pids from htop to a thread
dump from jstack). I've found it difficult to find much more concrete
information since nothing seems to actually be 'stuck', the best I was able
to gleam was the following result from /_cat/thread_pool during one of the
load spikes:
host id mas maa maq
(graylog2) T9hD 1 1 0
(es-primary) YG9x 5 5 100
If I repeatedly query the thread_pool during a spike I will occasionally
get these ~100 queued management threads, though I wasn't able to capture
what these threads are trying to do.
Has anyone seen this behavior before, or recognize it? I'd be happy to
provide more information - up until now I've been using elasticsearch
mostly as a blackbox component of graylog, so I'm not very familiar with
debugging it.
I'm running a set of very simple elasticsearch instances as part of a
graylog2 deployment. Each set has a single elasticsearch node (its own
cluster). I recently upgraded these sets to 1.34 as part of an upgrade to
the graylog2 server, and I immediately noticed some periodic high loads on
the machines involved; here's a cpu and load graph from one of the upgrades:
https://lh5.googleusercontent.com/-VpRVGkOajg8/VHzUsvLe1NI/AAAAAAAABmk/PIXlnNboHwc/s1600/cpuandload.png
The upgrade occurred at ~12pm (you can see the spike on the ProcessorLoad
graph). There are now periods of fairly high load, it goes up to ~5 on
this graph, though when watching the machine through htop or the like, 5
minute load tops out at about 8 at the start of any given spike. I've
determined that the machine is not bound by cpu, memory, or I/O during
these events, and I've also confirmed that there is no GC thrashing.
I don't see anything in the logs of either elasticsearch or graylog2 that
line up with the spikes.
When the spike is going on, all 5 threads from the management pool tend to
be active (learned this by comparing the running pids from htop to a thread
dump from jstack). I've found it difficult to find much more concrete
information since nothing seems to actually be 'stuck', the best I was able
to gleam was the following result from /_cat/thread_pool during one of the
load spikes:
host id mas maa maq
(graylog2) T9hD 1 1 0
(es-primary) YG9x 5 5 100
If I repeatedly query the thread_pool during a spike I will occasionally
get these ~100 queued management threads, though I wasn't able to capture
what these threads are trying to do.
Has anyone seen this behavior before, or recognize it? I'd be happy to
provide more information - up until now I've been using elasticsearch
mostly as a blackbox component of graylog, so I'm not very familiar with
debugging it.
I've done some poking around with hot_threads during spikes as you've
suggested, put some of the output here:
As noted in the gist - normally the hottest threads are from the management
pool (at around 4-8%) and they are normally in a lock when the call
happens. I did on occasion see these management threads in
"org.elasticsearch.action.support.broadcast.TransportBroadcastOperationAction$ShardTransportHandler.messageReceived"
with pretty high cpu (50%). I also have seen "Lucene Merge Thread"s with
very high cpu on occasion (90%+). These both seem like operations that
could have fairly high cpu over the short term, though that's uninformed
speculation on my part.
Graylog2's server itself is not very dynamic in terms of what's showing up
in hot_threads so I've left it out above. Generally I see the same set of
I/O processing threads all under 4%.
Does any of that seem unusual or point to a problem?
On Monday, December 1, 2014 5:55:49 PM UTC-5, Mark Walkom wrote:
On 2 December 2014 at 08:23, Michael McGuinness <hunte...@gmail.com
<javascript:>> wrote:
I'm running a set of very simple elasticsearch instances as part of a
graylog2 deployment. Each set has a single elasticsearch node (its own
cluster). I recently upgraded these sets to 1.34 as part of an upgrade to
the graylog2 server, and I immediately noticed some periodic high loads on
the machines involved; here's a cpu and load graph from one of the upgrades:
https://lh5.googleusercontent.com/-VpRVGkOajg8/VHzUsvLe1NI/AAAAAAAABmk/PIXlnNboHwc/s1600/cpuandload.png
The upgrade occurred at ~12pm (you can see the spike on the ProcessorLoad
graph). There are now periods of fairly high load, it goes up to ~5 on
this graph, though when watching the machine through htop or the like, 5
minute load tops out at about 8 at the start of any given spike. I've
determined that the machine is not bound by cpu, memory, or I/O during
these events, and I've also confirmed that there is no GC thrashing.
I don't see anything in the logs of either elasticsearch or graylog2 that
line up with the spikes.
When the spike is going on, all 5 threads from the management pool tend
to be active (learned this by comparing the running pids from htop to a
thread dump from jstack). I've found it difficult to find much more
concrete information since nothing seems to actually be 'stuck', the best I
was able to gleam was the following result from /_cat/thread_pool during
one of the load spikes:
host id mas maa maq
(graylog2) T9hD 1 1 0
(es-primary) YG9x 5 5 100
If I repeatedly query the thread_pool during a spike I will occasionally
get these ~100 queued management threads, though I wasn't able to capture
what these threads are trying to do.
Has anyone seen this behavior before, or recognize it? I'd be happy to
provide more information - up until now I've been using elasticsearch
mostly as a blackbox component of graylog, so I'm not very familiar with
debugging it.
I assume you have ported old data from 0.90 into 1.3 and continued to use
the same index in 1.3?
If so, the reason you see extra load is probably due to the feature that ES
1.3 tries to merge older 0.90 Lucene segments with new segments. By doing
that, the segments are upgraded in the background to a new Lucene codec
version.
I've done some poking around with hot_threads during spikes as you've
suggested, put some of the output here: Hot Threads · GitHub
As noted in the gist - normally the hottest threads are from the
management pool (at around 4-8%) and they are normally in a lock when the
call happens. I did on occasion see these management threads in
"org.elasticsearch.action.support.broadcast.TransportBroadcastOperationAction$ShardTransportHandler.messageReceived"
with pretty high cpu (50%). I also have seen "Lucene Merge Thread"s with
very high cpu on occasion (90%+). These both seem like operations that
could have fairly high cpu over the short term, though that's uninformed
speculation on my part.
Graylog2's server itself is not very dynamic in terms of what's showing up
in hot_threads so I've left it out above. Generally I see the same set of
I/O processing threads all under 4%.
Does any of that seem unusual or point to a problem?
On Monday, December 1, 2014 5:55:49 PM UTC-5, Mark Walkom wrote:
It'd be worth starting at hot threads; http://www.elasticsearch.org/
guide/en/elasticsearch/reference/current/cluster-nodes-hot-threads.html#
cluster-nodes-hot-threads
On 2 December 2014 at 08:23, Michael McGuinness hunte...@gmail.com
wrote:
I'm running a set of very simple elasticsearch instances as part of a
graylog2 deployment. Each set has a single elasticsearch node (its own
cluster). I recently upgraded these sets to 1.34 as part of an upgrade to
the graylog2 server, and I immediately noticed some periodic high loads on
the machines involved; here's a cpu and load graph from one of the upgrades:
https://lh5.googleusercontent.com/-VpRVGkOajg8/VHzUsvLe1NI/AAAAAAAABmk/PIXlnNboHwc/s1600/cpuandload.png
The upgrade occurred at ~12pm (you can see the spike on the
ProcessorLoad graph). There are now periods of fairly high load, it goes
up to ~5 on this graph, though when watching the machine through htop or
the like, 5 minute load tops out at about 8 at the start of any given
spike. I've determined that the machine is not bound by cpu, memory, or I/O
during these events, and I've also confirmed that there is no GC thrashing.
I don't see anything in the logs of either elasticsearch or graylog2
that line up with the spikes.
When the spike is going on, all 5 threads from the management pool tend
to be active (learned this by comparing the running pids from htop to a
thread dump from jstack). I've found it difficult to find much more
concrete information since nothing seems to actually be 'stuck', the best I
was able to gleam was the following result from /_cat/thread_pool during
one of the load spikes:
host id mas maa maq
(graylog2) T9hD 1 1 0
(es-primary) YG9x 5 5 100
If I repeatedly query the thread_pool during a spike I will occasionally
get these ~100 queued management threads, though I wasn't able to capture
what these threads are trying to do.
Has anyone seen this behavior before, or recognize it? I'd be happy to
provide more information - up until now I've been using elasticsearch
mostly as a blackbox component of graylog, so I'm not very familiar with
debugging it.
You are correct, I left indices in place. Unfortunately, I have been able
to replicate the behavior on one of the machines after deleting all indices
from it and starting fresh.
I'm going to try and replicate on fresh vm now that I have resources
available (it's a vmware + chef setup).
On Tuesday, December 2, 2014 3:26:59 PM UTC-5, Jörg Prante wrote:
I assume you have ported old data from 0.90 into 1.3 and continued to use
the same index in 1.3?
If so, the reason you see extra load is probably due to the feature that
ES 1.3 tries to merge older 0.90 Lucene segments with new segments. By
doing that, the segments are upgraded in the background to a new Lucene
codec version.
Jörg
On Tue, Dec 2, 2014 at 5:15 PM, Michael McGuinness <hunte...@gmail.com
<javascript:>> wrote:
I've done some poking around with hot_threads during spikes as you've
suggested, put some of the output here: Hot Threads · GitHub
As noted in the gist - normally the hottest threads are from the
management pool (at around 4-8%) and they are normally in a lock when the
call happens. I did on occasion see these management threads in
"org.elasticsearch.action.support.broadcast.TransportBroadcastOperationAction$ShardTransportHandler.messageReceived"
with pretty high cpu (50%). I also have seen "Lucene Merge Thread"s with
very high cpu on occasion (90%+). These both seem like operations that
could have fairly high cpu over the short term, though that's uninformed
speculation on my part.
Graylog2's server itself is not very dynamic in terms of what's showing
up in hot_threads so I've left it out above. Generally I see the same set
of I/O processing threads all under 4%.
Does any of that seem unusual or point to a problem?
On Monday, December 1, 2014 5:55:49 PM UTC-5, Mark Walkom wrote:
It'd be worth starting at hot threads; http://www.elasticsearch.org/
guide/en/elasticsearch/reference/current/cluster-nodes-hot-threads.html#
cluster-nodes-hot-threads
On 2 December 2014 at 08:23, Michael McGuinness hunte...@gmail.com
wrote:
I'm running a set of very simple elasticsearch instances as part of a
graylog2 deployment. Each set has a single elasticsearch node (its own
cluster). I recently upgraded these sets to 1.34 as part of an upgrade to
the graylog2 server, and I immediately noticed some periodic high loads on
the machines involved; here's a cpu and load graph from one of the upgrades:
https://lh5.googleusercontent.com/-VpRVGkOajg8/VHzUsvLe1NI/AAAAAAAABmk/PIXlnNboHwc/s1600/cpuandload.png
The upgrade occurred at ~12pm (you can see the spike on the
ProcessorLoad graph). There are now periods of fairly high load, it goes
up to ~5 on this graph, though when watching the machine through htop or
the like, 5 minute load tops out at about 8 at the start of any given
spike. I've determined that the machine is not bound by cpu, memory, or I/O
during these events, and I've also confirmed that there is no GC thrashing.
I don't see anything in the logs of either elasticsearch or graylog2
that line up with the spikes.
When the spike is going on, all 5 threads from the management pool tend
to be active (learned this by comparing the running pids from htop to a
thread dump from jstack). I've found it difficult to find much more
concrete information since nothing seems to actually be 'stuck', the best I
was able to gleam was the following result from /_cat/thread_pool during
one of the load spikes:
host id mas maa maq
(graylog2) T9hD 1 1 0
(es-primary) YG9x 5 5 100
If I repeatedly query the thread_pool during a spike I will
occasionally get these ~100 queued management threads, though I wasn't able
to capture what these threads are trying to do.
Has anyone seen this behavior before, or recognize it? I'd be happy to
provide more information - up until now I've been using elasticsearch
mostly as a blackbox component of graylog, so I'm not very familiar with
debugging it.
Some defaults in segment merge settings have been changed since 0.90 so I
suggest to check if you want to modify them. What you see is not much of
concern, it reveals that receiving docs is active and the merge runs try to
keep up with indexing the documents.
You are correct, I left indices in place. Unfortunately, I have been able
to replicate the behavior on one of the machines after deleting all indices
from it and starting fresh.
I'm going to try and replicate on fresh vm now that I have resources
available (it's a vmware + chef setup).
On Tuesday, December 2, 2014 3:26:59 PM UTC-5, Jörg Prante wrote:
I assume you have ported old data from 0.90 into 1.3 and continued to use
the same index in 1.3?
If so, the reason you see extra load is probably due to the feature that
ES 1.3 tries to merge older 0.90 Lucene segments with new segments. By
doing that, the segments are upgraded in the background to a new Lucene
codec version.
Jörg
On Tue, Dec 2, 2014 at 5:15 PM, Michael McGuinness hunte...@gmail.com
wrote:
I've done some poking around with hot_threads during spikes as you've
suggested, put some of the output here: https://gist.github.com/
mmcguinn/bb9de3f5f534d2581f62
As noted in the gist - normally the hottest threads are from the
management pool (at around 4-8%) and they are normally in a lock when the
call happens. I did on occasion see these management threads in
"org.elasticsearch.action.support.broadcast.
TransportBroadcastOperationAction$ShardTransportHandler.messageReceived"
with pretty high cpu (50%). I also have seen "Lucene Merge Thread"s with
very high cpu on occasion (90%+). These both seem like operations that
could have fairly high cpu over the short term, though that's uninformed
speculation on my part.
Graylog2's server itself is not very dynamic in terms of what's showing
up in hot_threads so I've left it out above. Generally I see the same set
of I/O processing threads all under 4%.
Does any of that seem unusual or point to a problem?
On Monday, December 1, 2014 5:55:49 PM UTC-5, Mark Walkom wrote:
On 2 December 2014 at 08:23, Michael McGuinness hunte...@gmail.com
wrote:
I'm running a set of very simple elasticsearch instances as part of a
graylog2 deployment. Each set has a single elasticsearch node (its own
cluster). I recently upgraded these sets to 1.34 as part of an upgrade to
the graylog2 server, and I immediately noticed some periodic high loads on
the machines involved; here's a cpu and load graph from one of the upgrades:
https://lh5.googleusercontent.com/-VpRVGkOajg8/VHzUsvLe1NI/AAAAAAAABmk/PIXlnNboHwc/s1600/cpuandload.png
The upgrade occurred at ~12pm (you can see the spike on the
ProcessorLoad graph). There are now periods of fairly high load, it goes
up to ~5 on this graph, though when watching the machine through htop or
the like, 5 minute load tops out at about 8 at the start of any given
spike. I've determined that the machine is not bound by cpu, memory, or I/O
during these events, and I've also confirmed that there is no GC thrashing.
I don't see anything in the logs of either elasticsearch or graylog2
that line up with the spikes.
When the spike is going on, all 5 threads from the management pool
tend to be active (learned this by comparing the running pids from htop to
a thread dump from jstack). I've found it difficult to find much more
concrete information since nothing seems to actually be 'stuck', the best I
was able to gleam was the following result from /_cat/thread_pool during
one of the load spikes:
host id mas maa maq
(graylog2) T9hD 1 1 0
(es-primary) YG9x 5 5 100
If I repeatedly query the thread_pool during a spike I will
occasionally get these ~100 queued management threads, though I wasn't able
to capture what these threads are trying to do.
Has anyone seen this behavior before, or recognize it? I'd be happy to
provide more information - up until now I've been using elasticsearch
mostly as a blackbox component of graylog, so I'm not very familiar with
debugging it.
Apache, Apache Lucene, Apache Hadoop, Hadoop, HDFS and the yellow elephant
logo are trademarks of the
Apache Software Foundation
in the United States and/or other countries.