Hi All,
We deployed filebeat to a handful of Windows Server 2012 VMs over the weekend and are seeing very high memory usage on all of the servers. I dug around and found a bunch of other mem leak issues, but none seemed directly applicable.

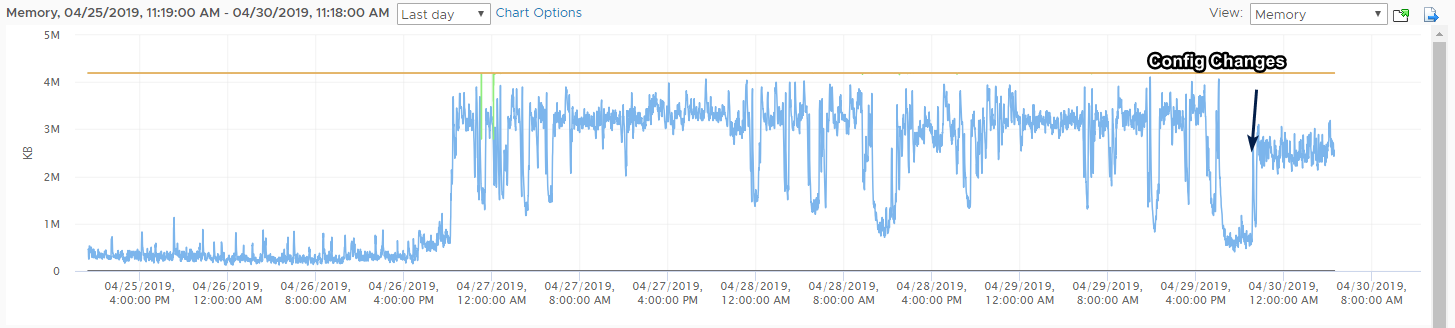
I made a couple config changes on another server (added the close and clean entries in the below config) and saw a small decrease, but it's still high.
Our config is pretty basic at this point and we haven't done much in the way of configuration.
- type: log
enabled: true
paths:
- C:\Windows\System32\LogFiles**
- C:\inetpub\logs**.log
- C:\inetpub\logs**.txt
- D:\logs**.log
- D:\logs**.txt
- D:\weblogs**.log
- D:\weblogs**.txt
- D:\content*\docs\App_Logs**.log
- D:\content*\docs\App_Logs**.txt
close_inactive: 2m
close_removed: true
clean_removed: true
filebeat.config.modules:
path: ${path.config}/modules.d/*.yml
reload.enabled: false
setup.template.settings:
index.number_of_shards: 3
output.logstash:
hosts: ["xxx.xx.xxxx:xxxx"]
processors:
- add_host_metadata: ~
- add_cloud_metadata: ~
I don't see any errors in the logs. Just harvesters going active and inactive. Not sure how many of them is normal. In the search below, it started ~4000 in 3 seconds.

Here's a metrics line if it's relevant.
2019-04-30T11:44:40.401-0500 INFO [monitoring] log/log.go:144 Non-zero metrics in the last 30s {"monitoring": {"metrics": {"beat":{"cpu":{"system":{"ticks":3269250,"time":{"ms":1734}},"total":{"ticks":31018546,"time":{"ms":16952},"value":31018546},"user":{"ticks":27749296,"time":{"ms":15218}}},"handles":{"open":8122},"info":{"ephemeral_id":"cf87ec45-cb91-43d9-bc3a-194a3a91cc42","uptime":{"ms":61890100}},"memstats":{"gc_next":925008144,"memory_alloc":546863192,"memory_total":2679270156384,"rss":6504448}},"filebeat":{"events":{"added":7612,"done":7612},"harvester":{"closed":3297,"open_files":7890,"running":12176,"started":4196}},"libbeat":{"config":{"module":{"running":0}},"output":{"events":{"acked":119,"batches":1,"total":119},"read":{"bytes":36},"write":{"bytes":12254}},"pipeline":{"clients":1,"events":{"active":1,"filtered":7494,"published":119,"total":7613},"queue":{"acked":119}}},"registrar":{"states":{"current":23180,"update":7612},"writes":{"success":165,"total":165}}}}}
