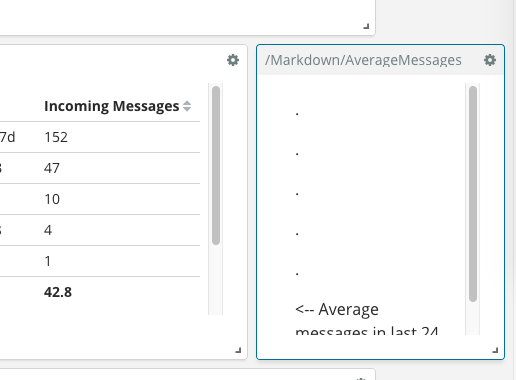
In our logging system, we have a unique ID tying together sets of operations, sort of like a "session" ID. I'm trying to show the average number of log messages per session. The closest I've gotten so far is using a sibling pipeline aggregation to show a data table with the count of messages bucketed by ID, then an average of those messages over time:

But this is not really useful to me. What I actually want is an average, across buckets, of that "Number of Messages" field. Is there a way to do this? I'm having trouble wrapping my head around it.
@markov00 can we please get some help here?
Thanks,
Bhavya
Got it.
In the Options tab, there's an option to "Show Total"

One "Total function" is avg

This puts the average across buckets at the bottom of the data table. There's no label or indication of how this number was calculated when you view it from the visualization or dashboard:
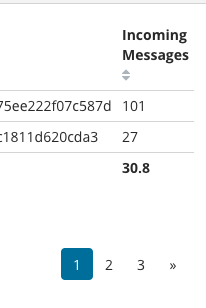
But at least I have this number somewhere and can see it now. I'd love to have it in a big, single-number, "Metric" visualization, but for now this is okay.
After a suggestion from a teammate today in standup, I've got that problem solved too