I'm really sorry if this isn't the right tag for this, I'm just not sure where to start.
I recently installed Filebeat, enabled the netflow module and pointed my Edgerouter X to my machine running the Elastic stack. I'm getting logs but I'm having trouble searching. Some searches work while others (IP addresses) don't. For example, here's an event that contains Nuremberg:
Absolutely that works. Using that logic though, to get the destination.geo.city_name as I did in the screenshot I'd have to specify that field and the city name: destination.geo.city_name:"Nuremberg" but I don't. I can simply search Nuremberg.
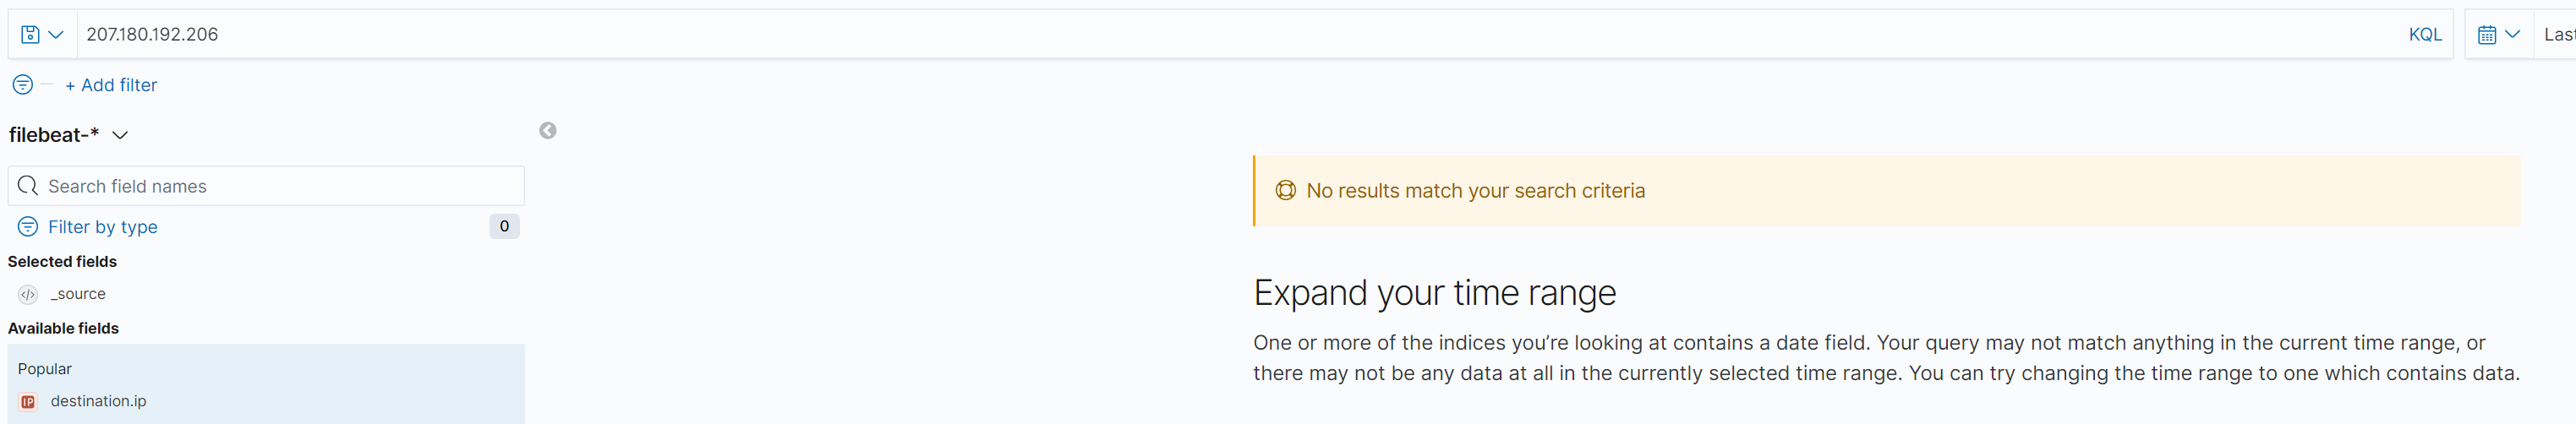
It's something to do with integers, I'm sure. Anything with a number fails to return results, unless specifically specifying field and exact terms as you mentioned. This isn't the case in my Winlogbeat index. I can put in any IP and return results. Screenshot taken moments ago.
2nd the proper KQL Syntax for both your searches are
destination.geo.city_name: "Nuremberg"
destination.ip: "207.180.192.206"
Those should always work as expected (you can skip the rest if that is all you need)
Why just putting in Nuremberg works is a little more nuanced.
destination.geo.city_name is of type keyword
When you just enter a Text like Nuremberg with out the field name Discover will search for that text in keyword and / or text fields it is a short hand search and it can be a bit confusing but still useful for a quick search.
In this case it matches destination.geo.city_name exactly which is the only way to match a keyword.
If you have "San Jose" as a city name in destination.geo.city_name you would need to search on "San Jose" in quotes otherwise the tokenizer will split it into San and Jose (without quotes) and it will not find either because the destination.geo.city_name is a keyword and the value is"San Jose" so it must be an exact match.
When you just enter "207.180.192.206" that is only found in the ip types fields so search does not find it (not to mention it tokenizes it into 200 180 192 206 if you put it in without quotes)
So in short when you just put text in the search bar without the field names it will search the text fields for a token that matches and the keyword fields for an exact match
if you enter EN-US without quotes it will break it up into EN and US....
Yes Elastic is a Search Engine ... and it works like one
So long story use the KQL syntaxt described here ... its pretty easy, there is type ahead built into the search bar and you will get expected results.
Thanks so much for the detailed answer. I really appreciate it.
So if I understand correctly, I can shorthand search a keyword or text field, but the destination.ip is not of type keyword or text. So could I change it to keyword or text? Would that give the results I'm looking for?
I ask because I work with the Elastic Stack every day in my regular job and I'm certainly able to shorthand search IP addresses. I'm just trying to learn how Elastic works on my own by building/experimenting on my own network.
So I tried the exact match on another field event.duration like you mentioned and it didn't return any records. I tried without the quotes and even increasing the time range. Any idea why it's not finding the exact match?
Me personally I would not change the type because the ip type allows a lot of other searching / query benefits like searching by a CIDR rule etc.
in addition the built in Security / SIEM app expects the IPs to be the correct ip type.
If IPs are in also in log messages or other text fields etc yes you can find them this / shorthand way, but you also may be finding the IP for a different reason.
See My Example below in this case it found the "198.98.61.24" because source.address is a text field but it did not find it via the source.ip which is an ip field. The highlight yellow indicates which field was found during the search... often there is a text and ip field, that may be what you are seeing.
I would not change the ip types in the Netflow modules or any of the other prebuilt modules but that is the great thing about Elasticsearch it is Open you can change what you like .... but you may affect / invalidate other parts of the Security App, Dashboards, Alerts, Detection, Anomaly Detection jobs etc. if you do. If you feel strongly you could add fields, but I would not change the existing mappings for the Pre Built Modules.
The formal search is better if you know what field you want to search. destination.ip: "207.180.192.206" the shorthand is good for a quick search but if you know you want to check to specifically search source.ip or destination.ip etc... I would use the KQL syntax
Interesting... What version are you on... event.duration should be a long not a float ... if it is a long you should be able to search for it ..... floats are a whole different matter (in short you do search on exact floats ... for all the float point / math reasons) you search on a range, gt, lt, lte etc....
BUT that said event.duration should be a long ... can you try
event.duration : "110001"
Also if there are commas etc you need to take them out... example 110,001 you would search on
event.duration : "110001"
Perhaps there is a bug in the display or more likely did you change any display settings in advanced settings? and just in case
This is what the number format should be... this controls the formatting in Kibana not how the data stored or the field type
Yeah... that is weird ... if you are interested ...which now I am ..we can check a few things.
One thought typically we are not searching for an exact duration (or number for that fact) we often search ranges, so I am not sure if this is a real use case or we just stumbled on it but lets take a look either way if you are interested.
Lets check a couple things...
First in discover try this and lets see if it pulls back the record (perhaps more)
event.duration > "3140" AND event.duration < "3142"
Next lets get the exact _index and doc _id and look at the
Thanks to your screenshots I think I have a really big clue. So I tried a range like you suggested and didn't get any results but I decided to filter on one of the durations. Then I checked out the filter:
So it looks like as long as I search by nanoseconds I get results. I'm not exactly sure how to fix/change this but I think this is the reason I'm not able to search for what's displayed in Kibana.
Remind Me Stack Version and Filebeat Version and this is Netflow modules correct / confirm?
Here is the docs on this....
It looks like (but you could break it ) ...but I don't think you will if you only change the Output Format display to Nanoseconds and 0 Decimal Places. I would NOT change the Input Format
I will have to poke into that I do not have anything with handy with nano seconds / same mapping type
But I think you found it... I learn something everyday Thanks!
Filebeat is: filebeat version 7.9.1 (amd64), libbeat 7.9.1 [ad823eca4cc74439d1a44351c596c12ab51054f5 built 2020-09-01 19:58:51 +0000 UTC]
Confirmed Netflow module for Filebeat. I tried changing the Input Format and the Output Format to seconds and removing the decimal. I don't think it's actually displaying in seconds though:
I would not have changed the input format... only the output
...oh. Well it looks like Kibana knows what's best for me and went and changed it back to nanoseconds anyway. This brings me back to my original problem. I have to search on nanoseconds and not milliseconds like I set to be displayed in the Index Pattern. I tried outputting to Logstash so I might be able to mutate the field but then I lose all the nice Dashboards from the Filebeat setup.
Apache, Apache Lucene, Apache Hadoop, Hadoop, HDFS and the yellow elephant
logo are trademarks of the
Apache Software Foundation
in the United States and/or other countries.


 ..we can check a few things.


