Good afternoon dear community. I turn to you with the following problem.
The custom rule does not create security alerts, although it works without visible errors.
Kibana Version: 8.3.1
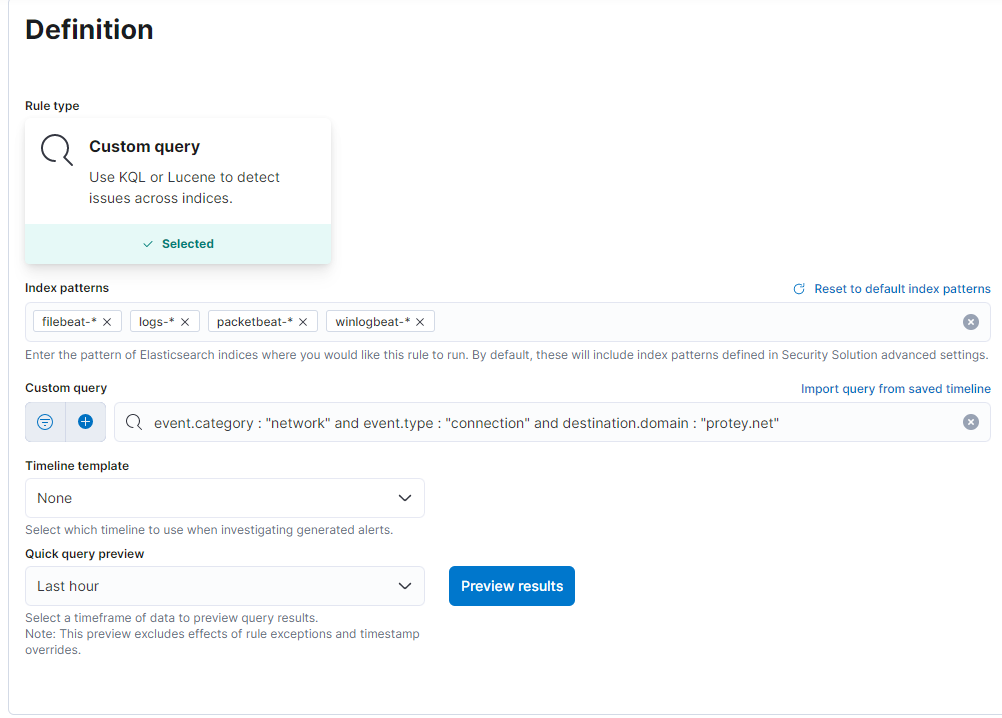
Rule type: custom query.
Rule query:
event.category : "network" and event.type : "connection" and destination.domain : "protey.net"
Index patterns: filebeat-* logs-* packetbeat-* winlogbeat-*
Rule preview:
Rule execution logs:

Please advise me what I am doing wrong. Thanks for any help.
Hello @Yuriy_Tsarenko
Can you share what is your interval and lookback time for a rule?
Maybe the reason that preview tries to find alerts for the last hour, but the default interval is 5 minutes + 1-minute look back time
Hi @Nikita_Khristinin
I set the time interval like this:

So are you sure that you have some events on that interval+look-back time?
As for a test you can increase your look-back time and check if it catches the old events. But for the real use case, you probably don't want the very big look-back time (because it will reprocess all old queries for each execution)
Oh sure. I generate events, and I specifically wait for the rule to be worked out.
It is noteworthy that the correlation rules work properly, those that I created myself.
But custom query - not created alerts.
But i see this events in Discover:
Yes, it's really interesting.
Just to be sure:
- Rule executed successfully, but no alerts are generated?
- You don't have any filters in the query bur on the rule page? (can lead to filtering events)
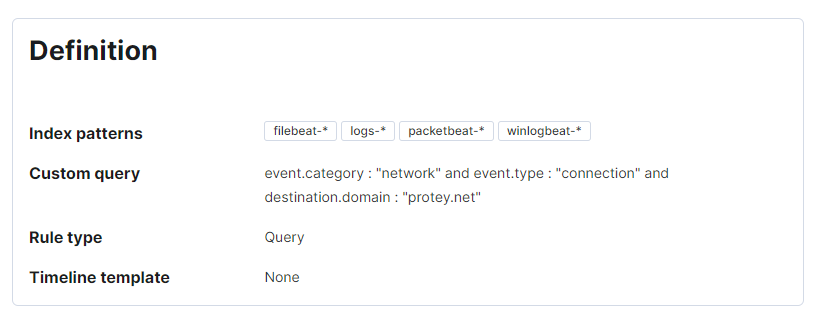
Can you maybe send the screenshot of your rule, so that I can see the configuration?
Yes, it's quite strange if you don't see any alerts in the rule, but see events in discovery for this time range.
Maybe it can be a good idea to debug this rule, it's a create a several a new one which contains only part of query like:
event.category : "network". Then you can see which rule has alerts, and which hasn't and maybe it five you the clue
Hi @Yuriy_Tsarenko, Sorry you are having trouble with your custom query rule producing expected alerts.
As a test, I created a similar rule on my 8.3.3 system, and it seems to be working fine for me. I have an alert for every document that appears in Discover. I am not aware of any query behavior differences between 8.3.1 and 8.3.3.
Here is my rule (of course, its query contains a different value of destination.domain), but is otherwise identical to your rule query
You can see over the past 56 hours, it generated 169 alerts, one for each document that matches the query. It runs every 5 minutes with 1 min additional look-back time.
Here is Discover over the same time period, by taking the rule query, and just pasting it into the KQL query bar. You can see I also get 169 documents.
So I can't see anything wrong with your query.
One possibility  is what @Nikita_Khristinin suggested earlier. Is there any chance that your data is delayed significantly before it is ingested into Elasticsearch? If it were delayed more than 9 minutes, then your rule query would "miss" it. Sometimes these delays can be caused by external queuing systems, or system clocks that are out of synchronization, or other conditions.
As a test to rule this out, can you modify your rule to have an additional look-back time of 20 minutes? And let us know if this makes a difference?
Thanks!
Thank you very much for your help and advice. The problem was solved, but I can not unequivocally point to its causes.
Steps:
And alerts began to come, just before that, all services and the server itself were restarted.
Something subtly influenced the fact that the rule did not work correctly.
Next, I added the domain to the request, and continued to receive alerts properly.
Kibana Version: 8.3.1