hello,
We have a problem with our ELK cluster. Logs retrieved by filebeat on our application servers are not completely displayed at the Kibana level.
We don't know if it's a log injection problem in ELK or if it's a display problem in Kibana.
We have a large and redundant infrastructure
We have 3 ELK Data, 3 elk Master. 2 indexer logstash with a REDIS broker, 2 front-end logstash and 1 kibana.
beat agent is filebeat which retrieves our logs from the application servers. Then sends to the 2 front end logstash in loadbalancing mode. Each frontend logstash sends the frame to a dedicated REDIS.
The logstash indexer takes over to format log line via GROK, then send to the ELK master.
our version is 7.17.x on all ELK components.
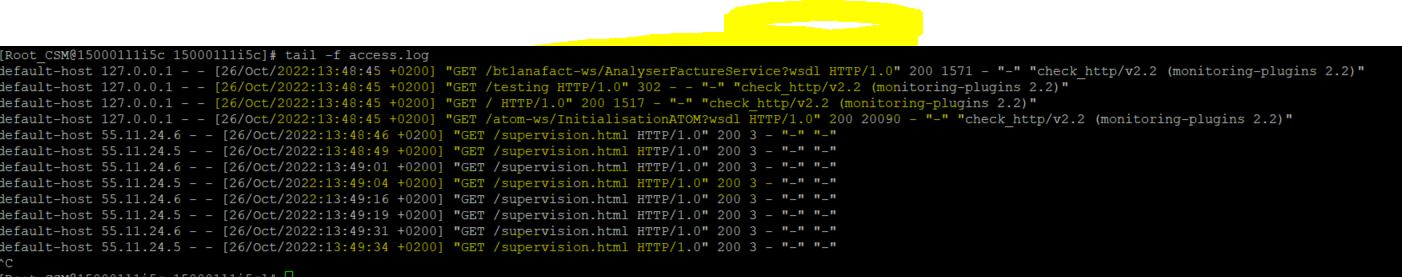
We are sending acces.log via the filestream “odm-filestream-access”, and the yellow lines do not seem to be visible in Kibana via discover.
###################### Filebeat Configuration Example #########################
This file is an example configuration file highlighting only the most common
options. The filebeat.reference.yml file from the same directory contains all the
supported options with more comments. You can use it as a reference.
You can find the full configuration reference here:
Filebeat Reference | Elastic
For more available modules and options, please see the filebeat.reference.yml sample
configuration file.
============================== Filebeat inputs pour ODM by KSA===============================
filebeat.inputs:
Each - is an input. Most options can be set at the input level, so
you can use different inputs for various configurations.
Below are the input specific configurations.
filestream is an input for collecting log messages from files.
-
type: filestream
id: odm-filestream-accessChange to true to enable this input configuration.
enabled: true
Paths that should be crawled and fetched. Glob based paths.
paths:
- /log/atom/15*/access.log
tags: ["odmaccess", "INTEX-RUN" ]
fields_under_root: true
exclude_lines: ['127.0.0.1', 'supervision.html']
- /log/atom/15*/access.log
#filestream is an input for collecting log messages from files.
-
type: filestream
id: odm-filestream-serverChange to true to enable this input configuration.
enabled: true
Paths that should be crawled and fetched. Glob based paths.
paths:
- /log/atom/server.log
tags: ["odmserver" , "INTEX-RUN"]
parsers: - multiline:
type: pattern
pattern: '[1]{4}-[0-9]{2}-[0-9]{2}'
negate: true
match: after
- /log/atom/server.log
#filestream is an input for collecting log messages from files.
-
type: filestream
id: odm-filestream-odmtarifChange to true to enable this input configuration.
enabled: true
Paths that should be crawled and fetched. Glob based paths.
paths:
- /log/atom/applications/bm1atom-tarif.log
tags: ["odmtarif" , "INTEX-RUN"]
parsers: - multiline:
type: pattern
pattern: '[2]{4}-[0-9]{2}-[0-9]{2}'
negate: true
match: after
- /log/atom/applications/bm1atom-tarif.log
#filestream is an input for collecting log messages from files.
-
type: filestream
id: odm-filestream-odmanafactChange to true to enable this input configuration.
enabled: true
Paths that should be crawled and fetched. Glob based paths.
paths:
- /log/atom/applications/bt1anafact.log
tags: ["odmanafact" , "INTEX-RUN"]
parsers: - multiline:
type: pattern
pattern: '[3]{4}-[0-9]{2}-[0-9]{2}'
negate: true
match: after
- /log/atom/applications/bt1anafact.log
filestream is an input for collecting log messages from files.
-
type: filestream
id: odm-filestream-odmperformancesChange to true to enable this input configuration.
enabled: true
Paths that should be crawled and fetched. Glob based paths.
paths:
- /log/atom/applications/bm1atom-performances.log
tags: ["odmperformances" , "INTEX-RUN"]
Exclude lines. A list of regular expressions to match. It drops the lines that are
matching any regular expression from the list.
#exclude_lines: ['^DBG']
Include lines. A list of regular expressions to match. It exports the lines that are
matching any regular expression from the list.
#include_lines: ['^ERR', '^WARN']
Exclude files. A list of regular expressions to match. Filebeat drops the files that
are matching any regular expression from the list. By default, no files are dropped.
#prospector.scanner.exclude_files: ['.gz$']
Optional additional fields. These fields can be freely picked
to add additional information to the crawled log files for filtering
#fields:
level: debug
review: 1
- /log/atom/applications/bm1atom-performances.log
============================== Filebeat modules ==============================
filebeat.config.modules:
Glob pattern for configuration loading
path: ${path.config}/modules.d/*.yml
Set to true to enable config reloading
reload.enabled: false
Period on which files under path should be checked for changes
#reload.period: 10s
======================= Elasticsearch template setting =======================
setup.template.settings:
index.number_of_shards: 3
#index.codec: best_compression
#_source.enabled: false
================================== General ===================================
The name of the shipper that publishes the network data. It can be used to group
all the transactions sent by a single shipper in the web interface.
#name:
The tags of the shipper are included in their own field with each
transaction published.
#tags: ["service-X", "web-tier"]
Optional fields that you can specify to add additional information to the
output.
#fields:
env: staging
================================= Dashboards =================================
These settings control loading the sample dashboards to the Kibana index. Loading
the dashboards is disabled by default and can be enabled either by setting the
options here or by using the setup command.
#setup.dashboards.enabled: false
The URL from where to download the dashboards archive. By default this URL
has a value which is computed based on the Beat name and version. For released
versions, this URL points to the dashboard archive on the artifacts.elastic.co
website.
#setup.dashboards.url:
=================================== Kibana ===================================
Starting with Beats version 6.0.0, the dashboards are loaded via the Kibana API.
This requires a Kibana endpoint configuration.
setup.kibana:
Kibana Host
Scheme and port can be left out and will be set to the default (http and 5601)
In case you specify and additional path, the scheme is required: http://localhost:5601/path
IPv6 addresses should always be defined as: https://[2001:db8::1]:5601
host: "150001l1it.cen.ramage:5601"
Kibana Space ID
ID of the Kibana Space into which the dashboards should be loaded. By default,
the Default Space will be used.
#space.id:
=============================== Elastic Cloud ================================
These settings simplify using Filebeat with the Elastic Cloud (https://cloud.elastic.co/).
The cloud.id setting overwrites the output.elasticsearch.hosts and
setup.kibana.host options.
You can find the cloud.id in the Elastic Cloud web UI.
#cloud.id:
The cloud.auth setting overwrites the output.elasticsearch.username and
output.elasticsearch.password settings. The format is <user>:<pass>.
#cloud.auth:
================================== Outputs ===================================
Configure what output to use when sending the data collected by the beat.
---------------------------- Elasticsearch Output ----------------------------
#output.elasticsearch:
Array of hosts to connect to.
#hosts: ["localhost:9200"]
Protocol - either http (default) or https.
#protocol: "https"
Authentication credentials - either API key or username/password.
#api_key: "id:api_key"
#username: "elastic"
#password: "changeme"
------------------------------ Logstash Output -------------------------------
output.logstash:
The Logstash hosts
hosts: ["150001l1ipa.cen.ramage:5044","150001l1ipb.cen.ramage:5044"]
timeout: 60
worker: 4
loadbalance: true
Optional SSL. By default is off.
List of root certificates for HTTPS server verifications
#ssl.certificate_authorities: ["/etc/pki/root/ca.pem"]
Certificate for SSL client authentication
#ssl.certificate: "/etc/pki/client/cert.pem"
Client Certificate Key
#ssl.key: "/etc/pki/client/cert.key"
================================= Processors =================================
processors:
- add_host_metadata:
when.not.contains.tags: forwarded - add_cloud_metadata: ~
- add_docker_metadata: ~
- add_kubernetes_metadata: ~
================================== Logging ===================================
Sets log level. The default log level is info.
Available log levels are: error, warning, info, debug
#logging.level: debug
At debug level, you can selectively enable logging only for some components.
To enable all selectors use ["*"]. Examples of other selectors are "beat",
"publisher", "service".
#logging.selectors: ["*"]
============================= X-Pack Monitoring ==============================
Filebeat can export internal metrics to a central Elasticsearch monitoring
cluster. This requires xpack monitoring to be enabled in Elasticsearch. The
reporting is disabled by default.
Set to true to enable the monitoring reporter.
#monitoring.enabled: false
Sets the UUID of the Elasticsearch cluster under which monitoring data for this
Filebeat instance will appear in the Stack Monitoring UI. If output.elasticsearch
is enabled, the UUID is derived from the Elasticsearch cluster referenced by output.elasticsearch.
#monitoring.cluster_uuid:
Uncomment to send the metrics to Elasticsearch. Most settings from the
Elasticsearch output are accepted here as well.
Note that the settings should point to your Elasticsearch monitoring cluster.
Any setting that is not set is automatically inherited from the Elasticsearch
output configuration, so if you have the Elasticsearch output configured such
that it is pointing to your Elasticsearch monitoring cluster, you can simply
uncomment the following line.
#monitoring.elasticsearch:
============================== Instrumentation ===============================
Instrumentation support for the filebeat.
#instrumentation:
# Set to true to enable instrumentation of filebeat.
#enabled: false
# Environment in which filebeat is running on (eg: staging, production, etc.)
#environment: ""

# APM Server hosts to report instrumentation results to.
#hosts:
#  - http://localhost:8200

# API Key for the APM Server(s).
# If api_key is set then secret_token will be ignored.
#api_key:

# Secret token for the APM Server(s).
#secret_token:
================================= Migration ==================================
This allows to enable 6.7 migration aliases
migration.6_to_7.enabled: true
Thanks for your support !