Query performance after 6.1.1 upgrade

We have a development / proof of concept / begging for funds stack that has been running for several months. I upgraded from 5.5 to 5.6.5 and everything seemed OK, then I upgraded to 6.1.1. Platform is physical (junk pile) servers running RHEL 7 and NL SAS PERC raid.

I have some pretty large python DSL queries that run either daily or every 8 hours processing the respective past 24/8 hours of data to product reports or data extracts. Before 6.1.1 they ran if a minute or two, they were stable, so I hadn't been watching them.

Since 6.1.1, one of these causes the cluster to lock up, the other runs slow, seems to block indexing and generates a LOT of gc messages.

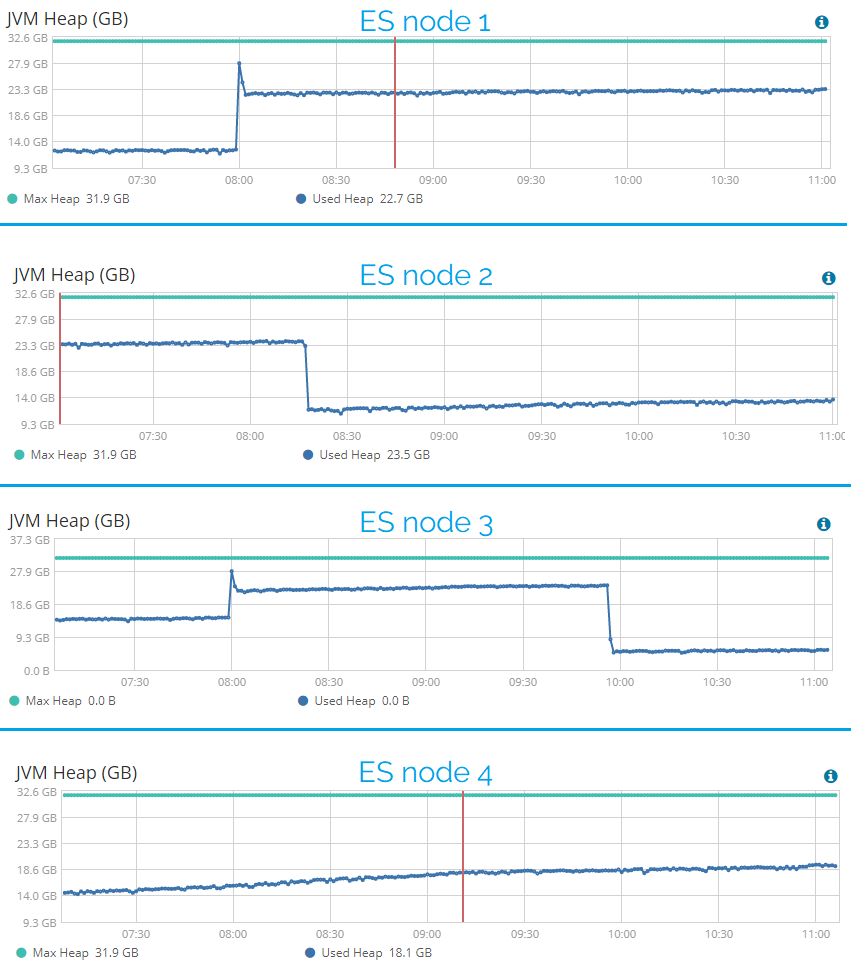
The data nodes have a 32G heap.

Any ideas what to look for?

Node stats:
{
"_nodes": {
"total": 7,
"successful": 7,
"failed": 0
},
"cluster_name": "elk-poc2",
"timestamp": 1515338351882,
"status": "green",
"indices": {
"count": 352,
"shards": {
"total": 2730,
"primaries": 1365,
"replication": 1,
"index": {
"shards": {
"min": 2,
"max": 10,
"avg": 7.755681818181818
},
"primaries": {
"min": 1,
"max": 5,
"avg": 3.877840909090909
},
"replication": {
"min": 1,
"max": 1,
"avg": 1
}
}
},
"docs": {
"count": 13129195226,
"deleted": 263482
},
"store": {
"size": "12.3tb",
"size_in_bytes": 13569499731142
},
"fielddata": {
"memory_size": "2.2mb",
"memory_size_in_bytes": 2409544,
"evictions": 0
},
"query_cache": {
"memory_size": "0b",
"memory_size_in_bytes": 0,
"total_count": 0,
"hit_count": 0,
"miss_count": 0,
"cache_size": 0,
"cache_count": 0,
"evictions": 0
},
"completion": {
"size": "0b",
"size_in_bytes": 0
},
"segments": {
"count": 68749,
"memory": "28.2gb",
"memory_in_bytes": 30360765157,
"terms_memory": "23gb",
"terms_memory_in_bytes": 24696600599,
"stored_fields_memory": "4.2gb",
"stored_fields_memory_in_bytes": 4563301448,
"term_vectors_memory": "0b",
"term_vectors_memory_in_bytes": 0,
"norms_memory": "21.8mb",
"norms_memory_in_bytes": 22861120,
"points_memory": "641.5mb",
"points_memory_in_bytes": 672761010,
"doc_values_memory": "386.4mb",
"doc_values_memory_in_bytes": 405240980,
"index_writer_memory": "164.5mb",
"index_writer_memory_in_bytes": 172520140,
"version_map_memory": "1mb",
"version_map_memory_in_bytes": 1134417,
"fixed_bit_set": "2.7mb",
"fixed_bit_set_memory_in_bytes": 2910384,
"max_unsafe_auto_id_timestamp": 1515286348612,
"file_sizes": {}
}
},
"nodes": {
"count": {
"total": 7,
"data": 4,
"coordinating_only": 0,
"master": 4,
"ingest": 7
},
"versions": [
"6.1.1"
],
"os": {
"available_processors": 168,
"allocated_processors": 168,
"names": [
{
"name": "Linux",
"count": 7
}
],
"mem": {
"total": "368.2gb",
"total_in_bytes": 395400986624,
"free": "6gb",
"free_in_bytes": 6456979456,
"used": "362.2gb",
"used_in_bytes": 388944007168,
"free_percent": 2,
"used_percent": 98
}
},
"process": {
"cpu": {
"percent": 31
},
"open_file_descriptors": {
"min": 725,
"max": 2223,
"avg": 1565
}
},
"jvm": {
"max_uptime": "1.8d",
"max_uptime_in_millis": 158225585,
"versions": [
{
"version": "1.8.0_151",
"vm_name": "OpenJDK 64-Bit Server VM",
"vm_version": "25.151-b12",
"vm_vendor": "Oracle Corporation",
"count": 7
}
],
"mem": {
"heap_used": "68.8gb",
"heap_used_in_bytes": 73908181168,
"heap_max": "174.9gb",
"heap_max_in_bytes": 187879391232
},
"threads": 1844
},
"fs": {
"total": "58.2tb",
"total_in_bytes": 64056450248704,
"free": "45.9tb",
"free_in_bytes": 50467831771136,
"available": "45.9tb",
"available_in_bytes": 50467831771136
},
"plugins": [
{
"name": "ingest-geoip",
"version": "6.1.1",
"description": "Ingest processor that uses looksup geo data based on ip adresses using the Maxmind geo database",
"classname": "org.elasticsearch.ingest.geoip.IngestGeoIpPlugin",
"has_native_controller": false,
"requires_keystore": false
},
{
"name": "x-pack",
"version": "6.1.1",
"description": "Elasticsearch Expanded Pack Plugin",
"classname": "org.elasticsearch.xpack.XPackPlugin",
"has_native_controller": true,
"requires_keystore": true
}
],
"network_types": {
"transport_types": {
"security4": 7
},
"http_types": {
"security4": 7
}
}
}
}

Maybe provide the queries (raw json)?

Some of my users have dashboards that aggregate 8 or 24 hours of data, these also cause the rapid GC's, so it's not just my queries.

This is from the python log, somewhat sanitized, this test just pulled 10 minutes of data, normally it was 8 hours.

"GET /my_indes-2018.01.07/_search HTTP/1.1" 200 8681786
INFO:elasticsearch:GET http://localhost:9200/exchange-2018.01.07/_search [status:200 request:97.493s]
DEBUG:elasticsearch:> {"query":{"bool":{"must":[{"match":{"type":"iis"}}],"filter":[{"range":{"@timestamp":{"lt":"now","gte":"now-10m"}}},{"bool":{"must_not":[{"match":{"tags":"VPN"}}]}}]}},"aggs":{"per_user":{"aggs":{"country":{"aggs":{"ip":{"aggs":{"time_min":{"min":{"field":"@timestamp"}},"agent":{"terms":{"field":"cs-useragent","size":100}},"time_max":{"max":{"field":"@timestamp"}}},"terms":{"field":"clientip","size":100}}},"terms":{"field":"geoip.country_name","size":100}}},"terms":{"field":"cs-user","size":30000}}},"size":0}
DEBUG:elasticsearch:< {"took":97363,"timed_out":false,"_shards":{"total":5,"successful":5,"skipped":0,"failed":0},"hits":{"total":321104,"max_score":0.0,"hits":},"aggregations":{"per_user":{"doc_count_error_upper_bound":0,"sum_other_doc_count":0,"buckets":[...

The upgrade finished before the 14:00 spike on the JVM Heap chart. "Before" we didn't have these spikes. These big reports ran at 06, 08, 14 & 22.

Here is a sample of the messages in the elasticsearch log:
[2018-01-07T20:12:21,172][INFO ][o.e.m.j.JvmGcMonitorService] [met-elk-poc-es2] [gc][24409] overhead, spent [275ms] collecting in the last [1s]
[2018-01-07T20:12:22,296][INFO ][o.e.m.j.JvmGcMonitorService] [met-elk-poc-es2] [gc][24410] overhead, spent [288ms] collecting in the last [1.1s]
[2018-01-07T20:12:23,421][INFO ][o.e.m.j.JvmGcMonitorService] [met-elk-poc-es2] [gc][24411] overhead, spent [283ms] collecting in the last [1.1s]
[2018-01-07T20:12:31,520][INFO ][o.e.m.j.JvmGcMonitorService] [met-elk-poc-es2] [gc][24418] overhead, spent [305ms] collecting in the last [1s]
[2018-01-07T20:12:32,521][INFO ][o.e.m.j.JvmGcMonitorService] [met-elk-poc-es2] [gc][24419] overhead, spent [315ms] collecting in the last [1s]
[2018-01-07T20:12:33,841][INFO ][o.e.m.j.JvmGcMonitorService] [met-elk-poc-es2] [gc][24420] overhead, spent [515ms] collecting in the last [1.3s]
[2018-01-07T20:12:35,843][INFO ][o.e.m.j.JvmGcMonitorService] [met-elk-poc-es2] [gc][24422] overhead, spent [337ms] collecting in the last [1s]

That is a typo, when I edited the logs.

The original query would have had exchange-* for the index and reported 100's of shards, but of course due to the timestamp match, only 1 or 2 really pull data. The search profiler says all the time is in the type:iis part. The index is about 80% that log type.

I'm not entirely sure this was the upgrade. The slope of JVM usage was gradually increasing it seems over the three days that you provided a screenshot for. Garbage collection, specifically the old collection, is triggered when usage reaches 75% of the heap. It appears you are using a 32gb heap (which you may want to check if compress object pointers are enabled / true: https://www.elastic.co/blog/a-heap-of-trouble), so gc old should kick at 24gb. The lowest utilization that I see is ~14gb (43%), but towards the end before the OOM / reboot - the low point was ~19gb (60%). This seems to indicate you had ~5gb available for query / other operations. It looks like after the reboot, it started with ~14gb and quickly jumped up to the 24gb (75%) and has not dropped - meaning heap pressure / you do not have enough available memory for either the normal traffic (queries, dashboards, etc) or the size of data. The gradual increase in memory usage could be an indication that you were adding data, and you might need to close / delete old data to free up memory. It is easy enough to try, just close some old indices and see if heap utilization drops. (closing an index does not delete the data, you can reopen the indices)

Thanks. It will be awhile before I can look at this. I was in an accident today and broke a few things

jpcarey Jared Carey Elastic Team Member
January 13 |

I'm not entirely sure this was the upgrade. The slope of JVM usage was gradually increasing it seems over the three days that you provided a screenshot for. Garbage collection, specifically the old collection, is triggered when use reaches 75% of the heap. It appears you are using a 32gb heap (which you may want to check if compress object pointers are enabled / true: A Heap of Trouble: Managing Elasticsearch's Managed Heap | Elastic Blog), so gc old should kick at 24gb. The lowest utilization that I see is ~14gb (43%), but towards the end before the OOM / reboot - the low point was ~19gb (60%). This seems to indicate you had ~5gb available for query / other operations. It looks like after the reboot, it started with ~14gb and quickly jumped up to the 24gb (75%) and has not dropped - meaning heap pressure / you do not have enough available memory for either the normal traffic (queries, dashboards, etc) or the size of data. The gradual increase in memory usage could be an indication that you were adding data, and you might need to close / delete old data to free up memory. It is easy enough to try, just close some old indices and see if heap utilization drops. (closing an index does not delete the data, you can reopen the indices)

Visit Topic or reply to this email to respond.

In Reply To

rugenl Len Rugen
January 8 |

That is a typo, when I edited the logs. The original query would have had exchange-* for the index and reported 100's of shards, but of course due to the timestamp match, only 1 or 2 really pull data. The search profiler says all the time is in the type:iis part. The index is about 80% that log …
Visit Topic or reply to this email to respond.

To unsubscribe from these emails, click here.

Thanks for the perspective on this, Jared--I work with Len and am trying to work on this while he's out.

I followed your advice and closed any indexes with data from 2017 (about 56% of our indexes) and saw the heap utilization drop across 3/4 all of the ES nodes (screenshot hopefully attached)

Is the fact that the heap usage didn't decrease on node 1 a concern at all? I would have expected to see a similar drop in utilization there, but that's not what we observed. Segment count did decrease on node 1 (as it did on the others) and index memory dropped from about 6 GB to 1.5 G, just like the other nodes as well.

About 30 minutes after posting this, heap utilization on the last node dropped down significantly and is now at the same level of the other nodes. We'll monitor things and let users kick it around to see if they see any service improvement at all. Thanks again for your help

It is concerning, since it appears to be right around 24gb - which is when
old garbage collection should kick in (75% of 32gb). I would suggest
checking the logs for any logs regarding collections. Are all the query
requests (ex. Kibana) being sent to this particular node?

This topic was automatically closed 28 days after the last reply. New replies are no longer allowed.