Hello, I'm testing indexing performance about es.
under these conditions :
-
ES 5.4.0 , a single node cluster.
-
-Xmx17179869184 -XX:MaxDirectMemorySize=17179869184
-
use _bulk api, 500docs per request.
-
20 clients of jmeter.
-
path.data:
/data2/zdh/elasticsearch/data,/data3/zdh/elasticsearch/data,/data4/zdh/elasticsearch/data,/data5/zdh/elasticsearch/data,/data6/zdh/elasticsearch/data,/data7/zdh/elasticsearch/data,/data8/zdh/elasticsearch/data,/data9/zdh/elasticsearch/data,/data10/zdh/elasticsearch/data,/data11/zdh/elasticsearch/data -
index named test with 12 shards.
-
disk infos.

-
memory info

-
cpu about 48 processors, top info:

results:
I use Jconsole to watch es, and I found lots of threads blocked at TranslogWriter.add()

and I found the memory used by off-heap is only 1G:
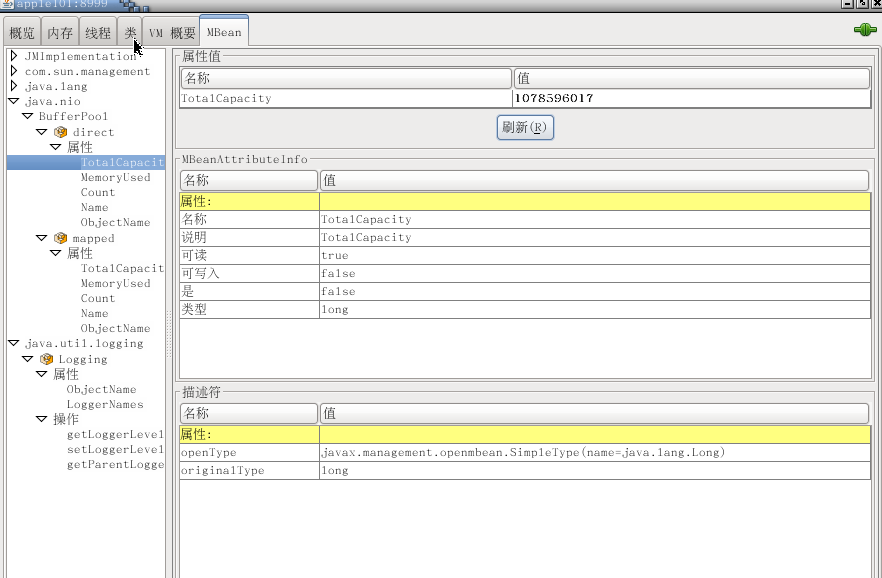
Is that OK?
and the IO:

at one moment , just one or two hard disk are busy, the others are idle. I do't know why.
thread pool about bulk:
"thread_pool" : {
"bulk" : {
"threads" : 32,
"queue" : 88,
"active" : 32,
"rejected" : 325,
"largest" : 32,
"completed" : 165387
}
memery usage of jvm: 37%
I think the disk is not been fully used , Is there anything I can do to optimize the performance? thank you.