I would like to share with you my usecase.
Elasticsearch information :
ES version : 6.5.1
Hot Nodes : 13 hot with 192Go RAM(Heap 94Go RAM), 5x500Go SSD, CPU * 2x Intel® Xeon® E5 2640 v4
Shards : Around 4.000 shards - some indexes have 32 shards and 1 replica (each shard have around 30Go data) and some indexes are smaller with 6 shards and 1 replica or 3 shards with 1 replica.
i also have some cold nodes but my concern is about hot nodes.
Connectivity : 10Gbit
Indexation rate : 100.000/s
Search rate : 60/s
java 1.8 with G1
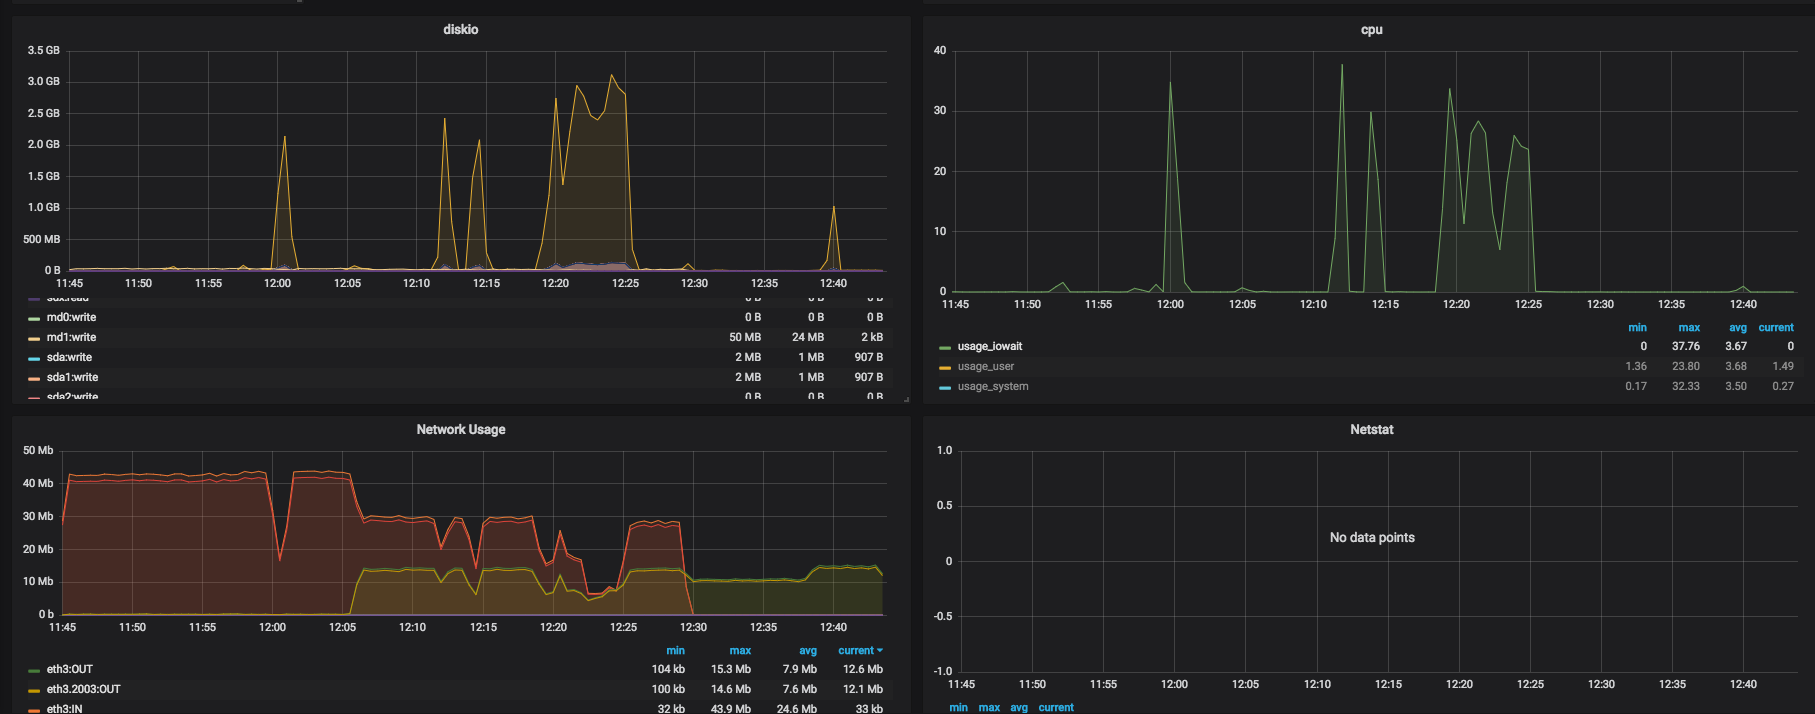
This cluster works pretty well but we have an issue when recovery shards occurs, the iowait increase with a read (40Mo/s) and write(100Mo/s) on disk (it's relatively low).
For example as you can see with my screenshot attached, around 8h50 a recovery occured then network usage in/out, disk write/read and iowait increased.
At this moment, bulk are rejected and queue is filled (queue size is 1000).
So my opinion is we have an issue when recovery/relocating of shards are occurring with our disks.
Do you have some advice about my configuration and my use case ?
Should i just add more nodes or is there anything else ?
It sounds like your disks can't keep up with the recovery, but I'm surprised that SSDs are struggling with this workload. I would investigate performance issues in your storage subsystem in isolation, trying to rule out Elasticsearch as a possible source of the problem.
Also, recovery is normally throttled to a maximum of 40 MB/s by the indices.recovery.max_bytes_per_sec setting, but your network usage graph indicates data was being sent quite a bit faster than this. Perhaps try reducing this setting to slow down the recovery and therefore to reduce the impact of the recovery on your cluster?
Thanks for your answer.
I'am also suprised because our read/write workload isn't a lot.
indices.recovery.max_bytes_per_sec setting is set to 40MB/s, i guess my network usage graph indicates data was being sent quite a bit faster than this because 20MB/s is our "normal" workload + 40MB/s from recovery.
I agree that reduce the indices.recovery.max_bytes_per_sec setting could help but we move too much data every night from hot to cold node and it will be very long with something like 20MB/s instead of 40MB/s.
About performance issues, i looked about :
"trim" for SSD, we are running on Centos7 and i saw some articles about it can improve performance, do you have a feedback about this ?
Oh yes, apologies, you are quite right. Looks normal.
As with all performance issues, the best way to proceed is with benchmarks. I think you need to perform some tests of your storage system in isolation to see if it's really struggling under this sort of load, and then you can quantify any improvements caused by changes to your configuration.
This is, I think, the first mention of heap usage in this thread.
We will try to dedicate some hot nodes for writing indexes and with nvme disk.
i did a benchmark on our disks, with ES running we have an increase of iowait and reach no more than 120MO/s in write.
And i tried to shutdown ES and run again the benchmark and i've had good results => around 600Mo/s in write
Was that writing randomly or sequentially, and was it concurrently reading? Elasticsearch's access pattern is not very sequential and involves both reads and writes.
As far as I understand the discussion so far, the problem is that you cannot process bulk requests when a recovery is running (you get bulk rejections because the queue is full after a while) and you are providing an increase in iowait time as evidence that the disk is fully utilized at that point. In general I could imagine that your system is already close to maximum utilization before a recovery starts and the recovery just pushes it over the maximum capacity.
W.r.t. analysis on system level you could use e.g. iostat or sar to get more detailed metrics like the number of read requests (maybe you read not much data overall but each individual read request is rather small and the system is swamped by too many of them. This could also explain the difference between your benchmark and what you see in production), see e.g. the USE method, specifically the "Storage device I/O" items, for details on what you should measure. Once you checked the metrics on a high level, you can dig deeper with other tools like bcc, you should check the path from VFS -> File Systems -> Volume Manager -> Block Device Interface to see if anything shows up.
In general I could imagine that your system is already close to maximum utilization before a recovery starts and the recovery just pushes it over the maximum capacity.
i agree with you but i would like to find what's our botteneck here, disk ? cpu ?
we have around 10iowait sometimes around 20/30 but iowait can be network too ? right ?
In my answer above I have provided specific suggestions with links to tools like iostat and the bcc tools collection that should allow you to investigate further and answer those questions. The metrics indicate that you are bottlenecked on I/O (because of I/O wait times, otherwise you'd see high user or system CPU).
i saw that i have my bottleneck on my disk because every time iowait occurs i can see with iostat or atop my disk is busy.
i'm going to benchmark some settings, i think about :
indices.memory.index_buffer_size from 10% to 30%
noatime on my disk
noop scheduler instead deadline
i tested :
async instead of request => changes nothing
refresh interval from 1s to 5s => changes nothing
Actually we have an increase of indexing time / load average / iowait when we are around 7,500 request indexing per second and around 100MO/s on disk.
i will bench again my disk with random write/read.
i started to use /hot_threads API but i'am not sur to understand very well how it works. I saw many "lucene merge segment to 100%", actually at end of a day we have something like 5.000 segments in our big index (2To of data).
i would like to be certain that we haven't other solution than add more nodes to scale up.
i added a new server to test it with less heap size and a bit less cpu but with more disk (24 ssd disks instead of 5 ssd disks)
surprised on this graph we have much more read io than write io.
Apache, Apache Lucene, Apache Hadoop, Hadoop, HDFS and the yellow elephant
logo are trademarks of the
Apache Software Foundation
in the United States and/or other countries.