Hello, dear Elastians and Kibanians.
I'm looking for a decent way to build a table of several fields. In my data I have huge objects with multiple boolean properties: Doc1
Obj.Property1 = 1
Obj.Property2 = 0
...
Obj.PropertyN = 1 Doc2
Obj.Property1 = 0
Obj.Property2 = 1
...
Obj.PropertyN = 1
I need to find out the most "popular" properties (those that are often set to 1) across all documents. Ideally, I'd like to have a table like this:
Property1, 456
Property1, 959
...
PropertyN, 0
Is there any way to achieve it without changing my data format?
It won't be easy to analyze and compare the data from single documents across multiple fields: you'll have to explicitly configure each field that you need to analyze for the numeric metric. If you have 1,000 of these types of fields, that isn't going to work so great, unless you are able to change the data format.
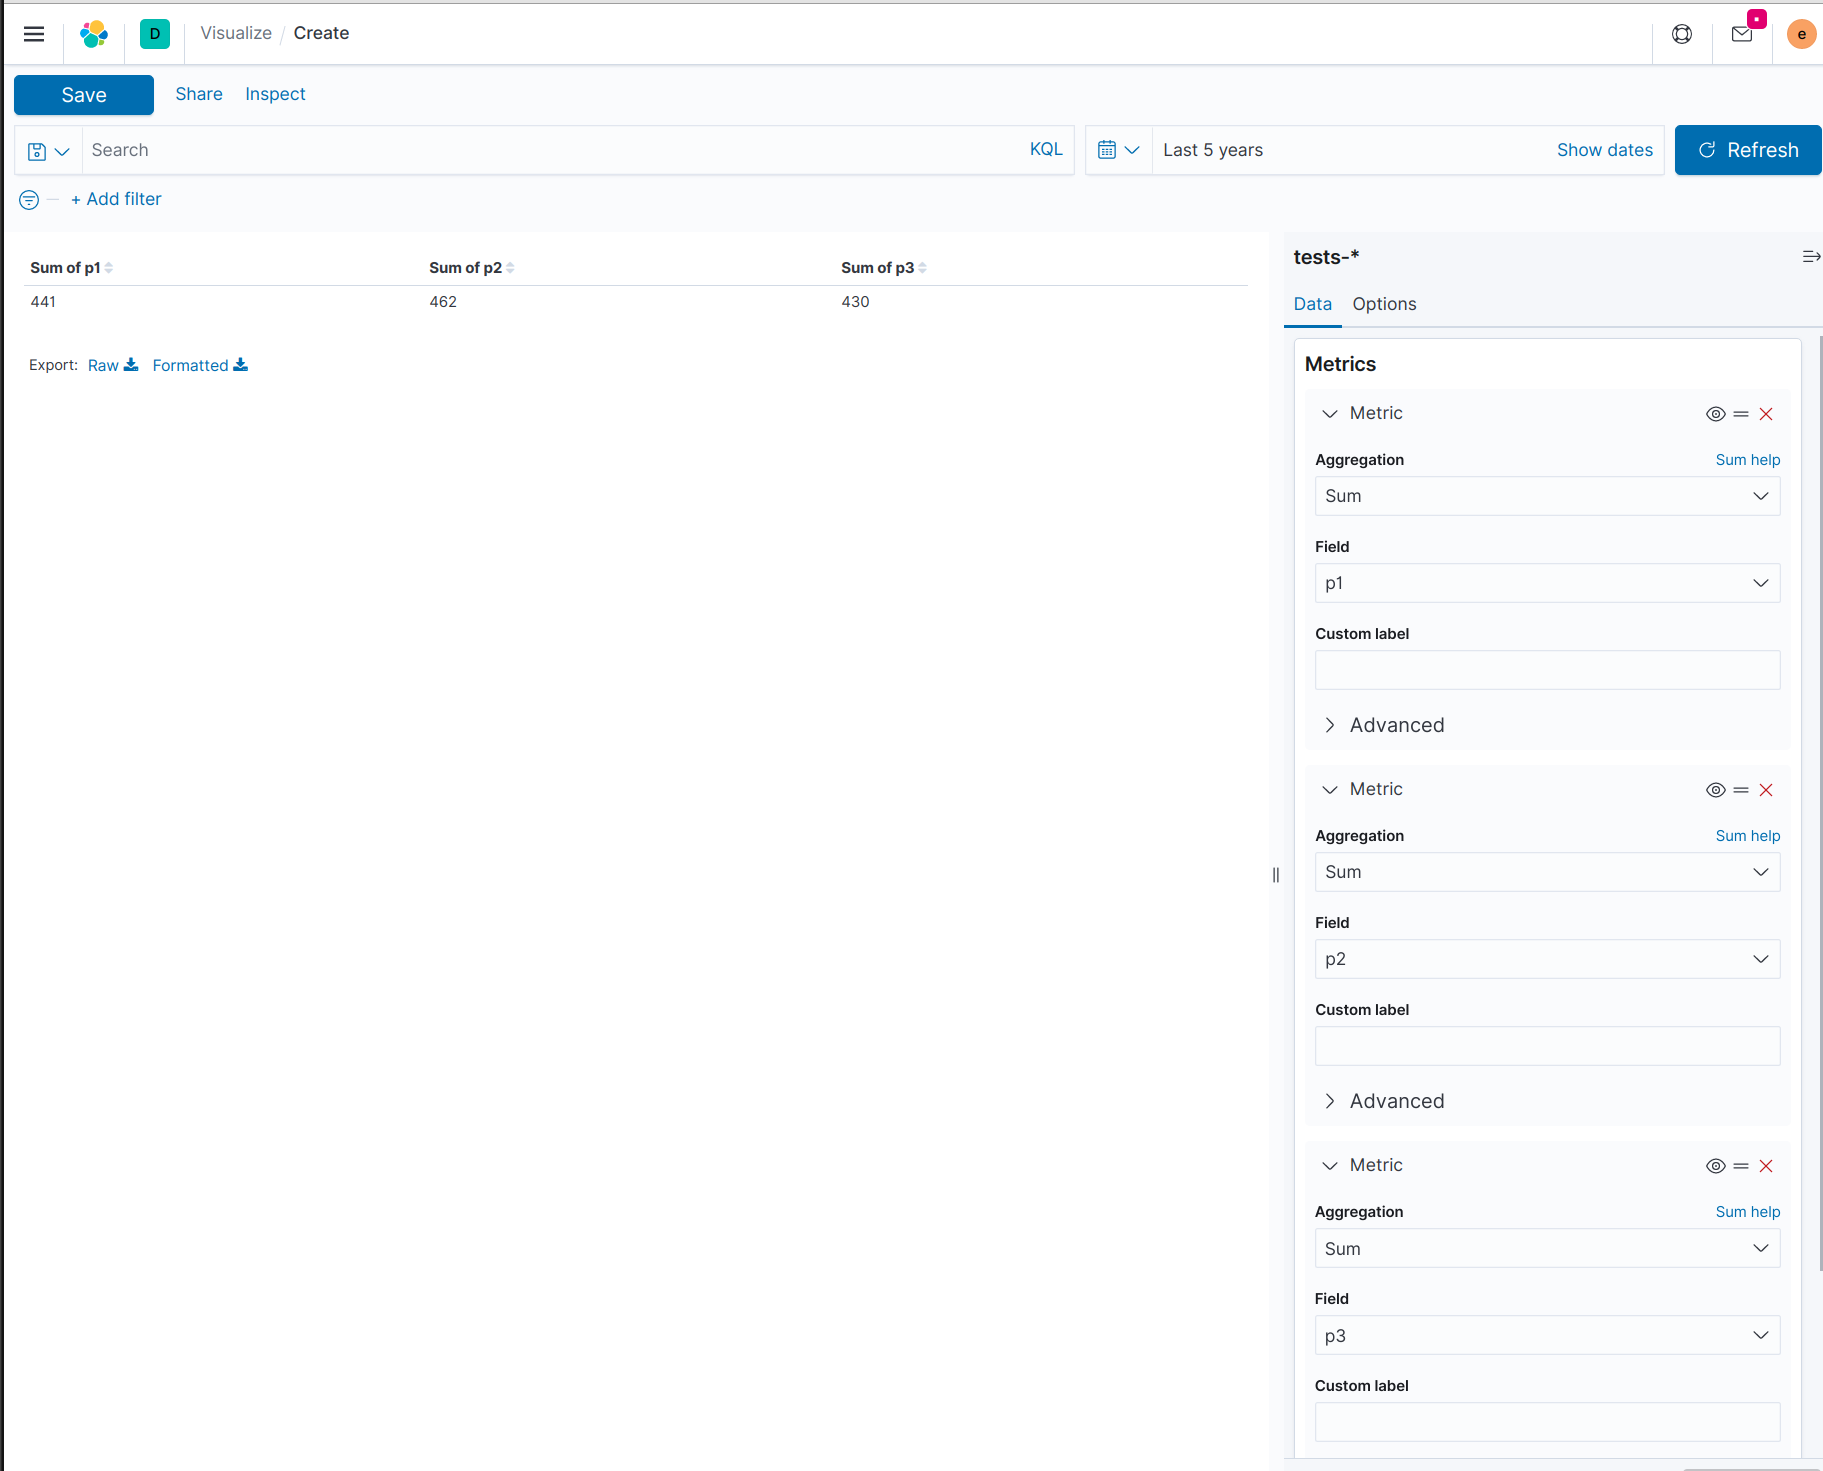
The furthest you could get with this format would be to manually add a metric column to sum the field, for each field you are interested in. For example:
Perhaps you need to stick with this data format because this index is based on an application that uses this format. Keep in mind you can create a different index that has the same data, but just in a different format. If you have a script that pulls data out of the application's datasource and indexes it into Elasticsearch, the script can "pivot" the data before it indexes it, or, it could keep the original versions and keep the original index up-to-date, but also creates a pivoted version to store in a separate index for analysis.
A format that would suit your use case can have documents only with a "propertyName" field.
{ "propertyName": "Property[1,2,...N]" }
Then you could simply do a terms aggregation on the propertyName field, to get the top propertyNames and their counts.
Thanks a lot, Tim.
That's what I was afraid of. Manually managing all these measures is a nightmare and, if I don't find anything good, I'll create a separate index to use terms aggregation against properties only.
Do you know if "Vega" visualisation could help me? I'm not very familiar with it yet.
Vega is not meant for tables: the Vega rendering is primarily visual, so you might not find interactive "spreadsheet-like" features such as sorting by column.
Let's say that you actually do have 1,000 fields that you want to look across. You would have to write a script that generates the query, by looping through an iterator and defining an aggregation for each field at the property name index of the iterator. Then you would want to copy and paste the output of that script into the Vega editor, to use as the 'url section.
The resulting data.url section would look like:
// An object instead of a string for the URL value
// is treated as a context-aware Elasticsearch query.
url: {
  // Specify the time filter.
  %timefield%: @timestamp
  // Apply dashboard context filters when set
  %context%: true

  // Which indexes to search
  index: eugenes_cool_index
  // The body element may contain "aggs" and "query" keys
  body: {
    aggs: {
      sumProperty1: {
        sum: {
          field: Property1
        }
      }
      sumProperty2: {
        sum: {
          field: Property2
        }
      }
      sumProperty3: {
        sum: {
          field: Property3
        }
      }

      ....

      sumPropertyN: {
        sum: {
          field: PropertyN
        }
      }
    }
    // Speed up the response by only including aggregation results
    size: 0
  }
}
Unfortunately, I don't think there is a way to get sorted values from the different aggregations.
The response from Elasticsearch would have something like:
The script that generates the query DSL would also need to generate the transform and encoding sections to convert the data in the aggregations into x/y table data for rendering the bar chart.
I'm not an expert in Vega, but things started to make a little bit more sense after looking at a visualization in the "web logs" Kibana sample data called "[Logs] File Type Scatter Plot"
Apache, Apache Lucene, Apache Hadoop, Hadoop, HDFS and the yellow elephant
logo are trademarks of the
Apache Software Foundation
in the United States and/or other countries.