Resource management with Ingest and Transform

Hi,

I currently have a running pipeline like this:
Filebeat -> Logstash -> Elasticsearch > Elasticsearch Transform

I'm trying to process 10GB of logs.

The data ingestion (Logstash -> Elasticsearch) takes 30 mins, use around 10% ram, and the JVM is around 40%.

The Transform takes 15 mins, use around 7% ram, and the JVM is also around 40%.

This is the case when I'm manually running the ingestion first, and then the Transform when the ingestion is done.

Now, I'm trying to run those two steps (ingestion and transform) at the same time, but Elasticsearch always crash at each Transform trigger, and cannot do two things at the same time...

My question is, how can this happen when each of this process consume very few resources? Is there a default configuration as "don't use more than 15% of what I allow you too" that I missed?

Can you post the error messages of your problem? What do you mean by "crash", an Out of Memory?

Are Logstash and Elasticsearch run on the same machine?
Can you post some more details about the pipeline and your transform?

Given the current information it is not possible to answer your question.

Can you post the error messages of your problem? What do you mean by "crash", an Out of Memory?

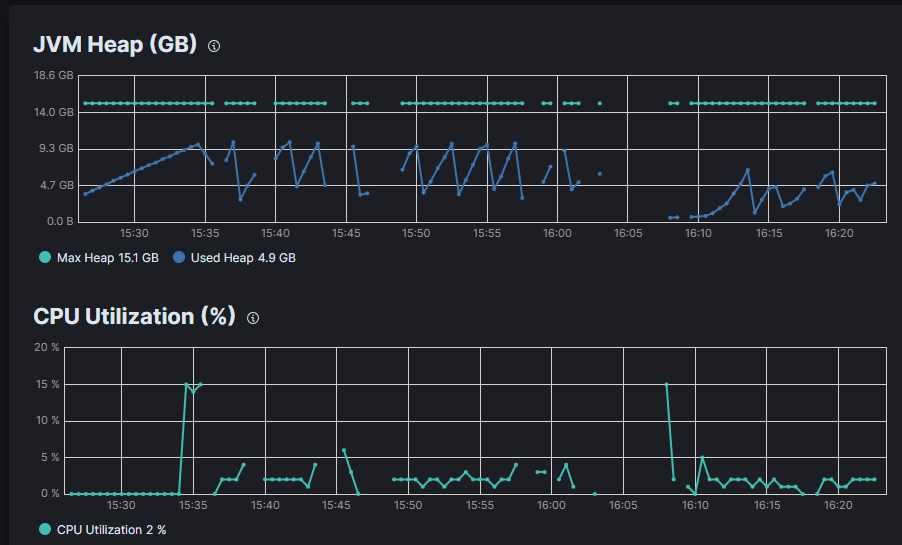
Hi, by crash I mean those gaps:

During this time, I have errors from Logstash telling me that Elasticsearch is unreachable.

In the Elasticsearch I have the following error every time the Transform try to start:

[object_transform] Search context missing, falling back to normal search; request [apply_results]
org.elasticsearch.action.search.SearchPhaseExecutionException: all shards failed

The result is that the Transform can't work (the trigger count doesn't increase) and Elasticsearch is not available for few minutes (stopping Logstash by the same occasion).

Are Logstash and Elasticsearch run on the same machine?

Yes on the same machine, the version is 8.1.2 for all, and the machine is a centos7 with 32gb of Ram, the JVM is at 16GB.

Can you post some more details about the pipeline and your transform?

Filebeat is listening to a folder, I drop 55 files (total size 10GB) with a mv command.

A Logstash pipeline is running, like this one:
https://www.elastic.co/guide/en/logstash/current/pipeline-to-pipeline.html#distributor-pattern

There is a Grok pattern who parse my logs (extension .log), with a bit of Ruby code and Logstash filter.

A template is in Elasticsearch and change the mapping of those logs (keep only the "keyword", reduce the "ignore above" and use the date_nanos on my timestamp).

About the Transform, I do a lot of things there. It's continuous (I try 5 / 10 / 20 mins but the problem is always there). It uses a Pivot followed by 4 group by. I also added few bucket-script in order to calculate the duration of few events (substracting timestamps), nothing with runtime field, only information already present in the logs.

About the memory use

The ingestion alone use around 20% ram and the JVM around half. It works well and need 30 mins.

The transform alone use around 7% ram and the JVM around half. It works well and need 15 mins.

Together, this is the end, the ram is around 5% and it doesn't progress.

Given the current information it is not possible to answer your question.

Tell me if you need anything else :slight_smile:

Found the problem... The pipeline doesn't work well because there are too many files!

Instead of 55 files for a total of 10GB, I merge them into a single one.

And it worked perfectly! The ingestion and transform are done together, the ram stay between 25-30% and there is no interruption of Elasticsearch.

Maybe the result can be obtained with the max_open_file argument, I will try and edit this post if it's the case:
plugins-inputs-file-max_open_files

sounds good. Your transform warning : Search context missing is/was probably the result of your Elasticsearch trouble. Transform uses the point in time API internally. The warning is benign, at it says it falls back to execute the search without point in time. However, the fallback causes some overhead.

16GB JVM on a 32GB machine: Is it 16GB in total for Elasticsearch and logstash? or 16 each? Ensure that you don't use too much RAM for the JVM, but always leave at least 50% in total for the system. This RAM isn't wasted, but is used for the filesystem cache.

1 Like

The 16GB is the size I see in the Kibana monitoring interface. If I'm running ELK on the same machine, there is only one JVM for all of them right?
Or EK is on one, and L make another one for itself?

By the way, is it recommended to run ELK on different machines? As one for logs + Logstash, and one for Elasticsearch + Kibana? To be sure that the overhead of some product doesn't affect the others?

Each product runs independently, so each consume memory on their own. So if you configure 16 GB for Logstash and 16GB for Elasticsearch you consumed in total 32GB. Kibana has no JVM size, because it is not based on Java, but it runs on NodeJs, of course it uses memory, too.

The main reason to run all 3 systems on different machines - which can be virtual ones, e.g. docker - is maintenance.

1 Like

Thanks!

This topic was automatically closed 28 days after the last reply. New replies are no longer allowed.