Hello Elastic Forum!
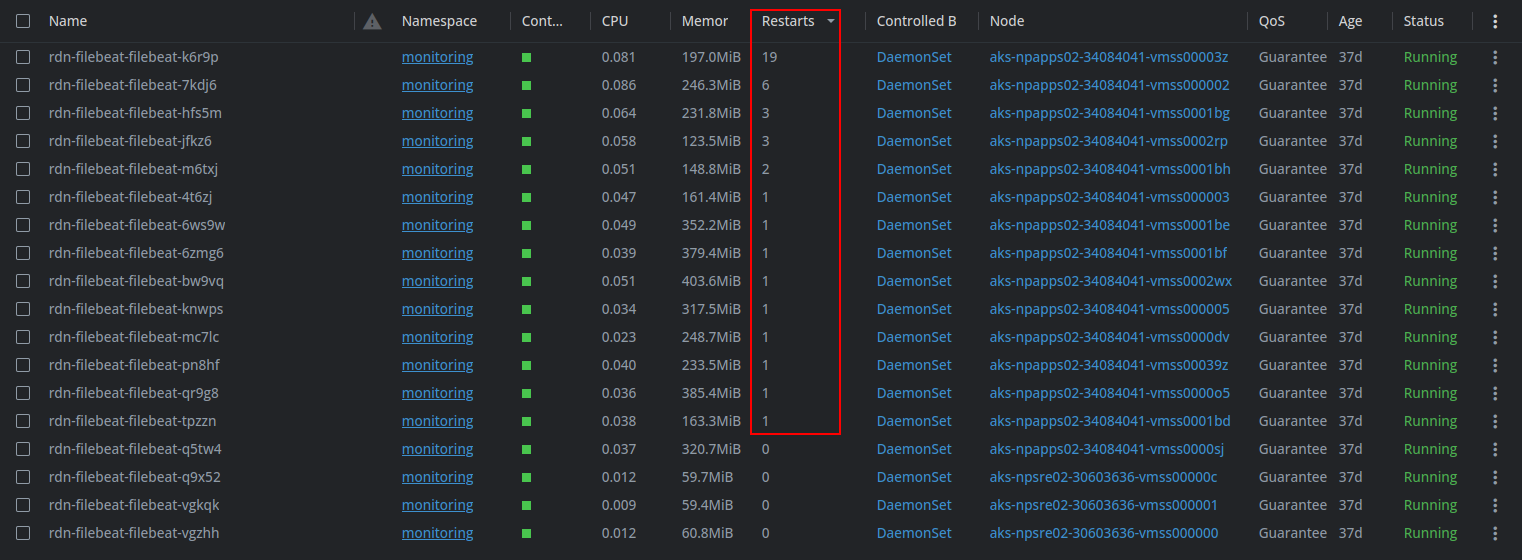
I've been having issues with Filebeat on our AKS clusters recently, it constantly restarts for no apparent reason. Two of our clusters are being affected by this, one for development and one for production.
I started an investigation to try and find the cause, but so far the only evidence I have found is the logs below:
{
    "log.level": "info",
    "log.logger": "input",
    "message": "input outlet closed",
    "service.name": "filebeat",
}
{
    "log.level": "error",
    "log.logger": "input",
    "message": "Problem putting initial state: input outlet closed",
    "service.name": "filebeat",
}
{
    "log.level": "error",
    "log.logger": "autodiscover.cfgfile",
    "message": "Error creating runner from config: input outlet closed",
    "service.name": "filebeat",
}
Despite Filebeat's restart episodes, it doesn't remain broken, after a few minutes it becomes healthy again in the cluster. We also took the following evidence regarding Kubernetes probes:
Readiness probe failed: command timed out: "sh -c #!/usr/bin/env bash -e\nfilebeat test output\n" timed out after 5s

Liveness probe failed: command timed out: "sh -c #!/usr/bin/env bash -e\ncurl --fail 127.0.0.1:5066\n" timed out after 5s
In our infrastructure we use the following pattern:
- Filebeat + Logstash within the AKS cluster collecting and processing application logs
- Elastic Cloud in the cloud, where it stores the data
Our versions:
[Development cluster]
- Azure Kubernetes Service (AKS) in the v1.31.2
- Filebeat and Logstash in the v8.17.4
- Elastic Cloud in the v8.17.4
[Production cluster]
- Azure Kubernetes Service (AKS) in the v1.31.2
- Filebeat and Logstash in the v8.17.2
- Elastic Cloud in the v8.17.2
Has anyone ever had a similar error or knows of any way to collect more information?
I also found these logs in the Logstash of the production environment.
Using bundled JDK: /usr/share/logstash/jdk
Sending Logstash logs to /usr/share/logstash/logs which is now configured via log4j2.properties
[2025-03-26T21:22:06,937][ERROR][logstash.outputs.elasticsearch][main][1d0...197] Attempted to send a bulk request but Elasticsearch appears to be unreachable or down {:message=>"Elasticsearch Unreachable: [https://[elastic-cloud-domain].azure.elastic-cloud.com:9243/_bulk?filter_path=errors,items.*.error,items.*.status][Manticore::ClientProtocolException] [elastic-cloud-domain].azure.elastic-cloud.com:9243 failed to respond", :exception=>LogStash::Outputs::ElasticSearch::HttpClient::Pool::HostUnreachableError, :will_retry_in_seconds=>2}
[2025-03-26T21:29:24,137][ERROR][logstash.outputs.elasticsearchmonitoring][.monitoring-logstash][e4b...197] Attempted to send a bulk request but Elasticsearch appears to be unreachable or down {:message=>"Elasticsearch Unreachable: [https://[elastic-cloud-domain].azure.elastic-cloud.com:9243/_monitoring/bulk?system_id=logstash&system_api_version=7&interval=1s&filter_path=errors,items.*.error,items.*.status][Manticore::ClientProtocolException] [elastic-cloud-domain].azure.elastic-cloud.com:9243 failed to respond", :exception=>LogStash::Outputs::ElasticSearch::HttpClient::Pool::HostUnreachableError, :will_retry_in_seconds=>2}
[2025-04-03T00:06:13,442][ERROR][com.microsoft.azure.eventprocessorhost.PumpManager][main][06a...f1e] host logstash-e1831fb0-f50f-4086-bd26-86e76390434c: 0: throwing away zombie pump
[2025-04-03T00:07:21,162][ERROR][logstash.inputs.azure.processor][main][06a...f1e] Event Hub: evh-application-logs, Partition: 0 experienced an error com.microsoft.azure.eventhubs.ReceiverDisconnectedException: New receiver 'nil' with higher epoch of '0' is created hence current receiver 'nil' with epoch '0' is getting disconnected. If you are recreating the receiver, make sure a higher epoch is used. TrackingId:f11a027a00015b490008e02867edd0f7_G12_B44, SystemTracker:[event-hubs-name]:eventhub:evh-application-logs~3276|evh-application-logs, Timestamp:2025-04-03T00:07:21, errorContext[NS: [event-hubs-name].servicebus.windows.net, PATH: evh-application-logs/ConsumerGroups/evh-application-logs/Partitions/0, REFERENCE_ID: LN_81a1c4_1743638775094_7ab_G12, PREFETCH_COUNT: 300, LINK_CREDIT: 297, PREFETCH_Q_LEN: 0])
[2025-04-15T13:58:59,891][ERROR][logstash.outputs.elasticsearch][main][1d0...197] Attempted to send a bulk request but Elasticsearch appears to be unreachable or down {:message=>"Elasticsearch Unreachable: [https://[elastic-cloud-domain].azure.elastic-cloud.com:9243/_bulk?filter_path=errors,items.*.error,items.*.status][Manticore::ClientProtocolException] [elastic-cloud-domain].azure.elastic-cloud.com:9243 failed to respond", :exception=>LogStash::Outputs::ElasticSearch::HttpClient::Pool::HostUnreachableError, :will_retry_in_seconds=>2}
[2025-04-15T13:59:01,896][ERROR][logstash.outputs.elasticsearch][main][1d0...197] Attempted to send a bulk request but there are no living connections in the pool (perhaps Elasticsearch is unreachable or down?) {:message=>"No Available connections", :exception=>LogStash::Outputs::ElasticSearch::HttpClient::Pool::NoConnectionAvailableError, :will_retry_in_seconds=>4}
[2025-04-25T00:59:12,634][ERROR][logstash.outputs.elasticsearchmonitoring][.monitoring-logstash][e4b...197] Attempted to send a bulk request but Elasticsearch appears to be unreachable or down {:message=>"Elasticsearch Unreachable: [https://[elastic-cloud-domain].azure.elastic-cloud.com:9243/_monitoring/bulk?system_id=logstash&system_api_version=7&interval=1s&filter_path=errors,items.*.error,items.*.status][Manticore::SocketTimeout] Read timed out", :exception=>LogStash::Outputs::ElasticSearch::HttpClient::Pool::HostUnreachableError, :will_retry_in_seconds=>2}
[2025-04-25T00:59:14,637][ERROR][logstash.outputs.elasticsearchmonitoring][.monitoring-logstash][e4b...197] Attempted to send a bulk request but there are no living connections in the pool (perhaps Elasticsearch is unreachable or down?) {:message=>"No Available connections", :exception=>LogStash::Outputs::ElasticSearch::HttpClient::Pool::NoConnectionAvailableError, :will_retry_in_seconds=>4}
I applied the following option within the filebeat.yml of my Filebeat.
filebeat.shutdown_timeout: 60s
Doc: Configure general settings | Filebeat Reference [8.9] | Elastic
I saw in an open issue on Github that can help with the problem, as soon as I have more complete results I'll come back here to report.
This approach didn't seem to have the effect I had hoped.
The mistakes continued, with a few others now.