RUM: correlation not found for CarList example

We tried the elastic stack blog carList example (https://www.elastic.co/blog/performing-real-user-monitoring-rum-with-elastic-apm) for looking into the distributed tracing. Both front side and backend are working at our environment (no elastic cloud). On APM/Kibana, we can see cardatabase and carfront responses individually without issues. However, we don't see the tracing data, especially looks like there is no correlation established between the carfront and cardatabase.

We cannot figure out why the correlation was missing between carfront and cardatabase (backedn). Please help.

From chrome developer tools, we do see that the carfront made two calls to the backend api. The first call has the following request and response headers (seems both are right)

Response Headers
Access-Control-Allow-Credentials: true
Access-Control-Allow-Headers: elastic-apm-traceparent
Access-Control-Allow-Methods: GET
Access-Control-Allow-Origin: http://10.40.33.180:8000

Request Headers
Access-Control-Request-Headers: elastic-apm-traceparent
Access-Control-Request-Method: GET
Origin: http://10.40.33.180:8000

the following components are used
Kibana version: 7.0.0
Elasticsearch version: 7.0.0
APM Server version: 7.0.0
APM Agent language and version: Java, 1.5.0
Browser version: google chrome: 74.0.3729.108

Hi and thanks for your question.

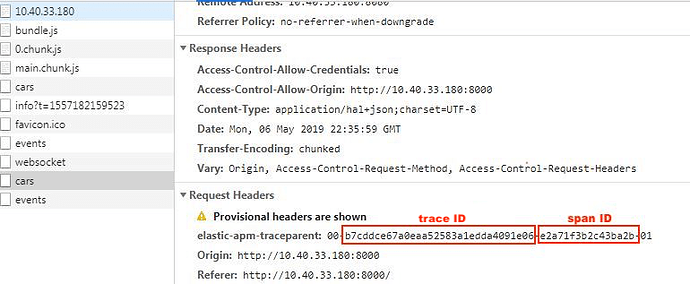
Can you find the traceparent header using your browser's debugging tools, like that:


?

second-call-header

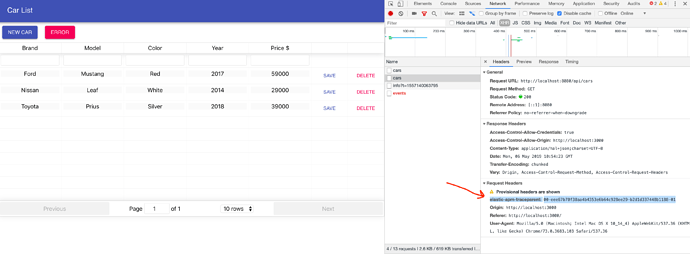
in fact, as mentioned in my last post, there are two calls to the backend. The header of the first call was copied there. the header of second call doesn't have APM custom stuff (such as Access-Control-Allow-Headers). I am attaching three screen captures here: (1) the call list showing two backend calls; (2) the header of the first call (haveing APM custom header); (3) the header of second call that doesnt have APM stuff.

dont know exactly why there are two calls to the backend, might be the protocol of CORS hand shake. The issue might be from the second call header doesnt have APM custom header, to my guess.

Your assumption seems to be right, this is probably related to the CORS handling. The first call should be invoking the HTTP OPTIONS action, which is a preflight request aimed exactly for getting those headers saying what the server would allow, and the second is the actual GET request, where the traceparent header should be, as it is indeed.

Let's try to further analyze:
The traceparent header contains trace ID and ID of the client span making the remote call, as follows:

Go to your APM tab, and filter by the trace ID:

You should get two transactions from both services (frontend and backend). Please choose the backend transaction and open it, then using the Actions drop down menu, find its document:

Make sure that the parent.id is the same as the span ID from the header.

If that's the case, please look for the document with this span ID in Discover:

If you find all of these, please upload:

  1. the frontend transaction document
  2. the backend transaction document
  3. the span document

Thanks,
Eyal.

thanks for your instructions. I am putting what I collected below. Indeed, the trace.id and span.id shown in chrome are found in the sample documents.

Not sure the reason the backend service is not shown on the overall transactions view. I am assuming there should be cardatabase as backend service in addition to carfront service. I am attaching a screen capture to show what I mean about front and backend services. If you look at the attached screen capture, i marked a circle in red color where the backend service is supposed to be (this is, in fact, from the original carList post (https://www.elastic.co/blog/performing-real-user-monitoring-rum-with-elastic-apm).

Please advise. Thanks

==From Request Headers of Chrome==
elastic-apm-traceparent: 00-ac2a4ef3c9741acb8bb9a9e22eb78b26-aaf4587b1ae10072-01

==Backend transaction document===
May 8, 2019 @ 09:26:22.446 processor.event:transaction trace.id:ac2a4ef3c9741acb8bb9a9e22eb78b26 transaction.id:c8e147c22e8e0b0d parent.id:aaf4587b1ae10072 agent.name:java agent.version:1.5.0 process.pid:7,469 process.title:/usr/java/jdk-10.0.2/bin/java process.ppid:7,040 processor.name:transaction url.path:/api/cars url.scheme:http url.port:8,080 url.domain:10.40.33.180 url.full:http://10.40.33.180:8080/api/cars observer.hostname:dev-docker01 observer.id:4676ae72-8f2d-438f-8dbe-e591333f1b5c observer.ephemeral_id:9955085b-a08e-4a59-8a5f-a68e41978632 observer.type:apm-server observer.version:7.0.0 observer.version_major:7 @timestamp:May 8, 2019 @ 09:26:22.446 ecs.version:1.1.0-dev service.name:cardatabase service.runtime.name:Java service.runtime.version:10.0.2 service.language.name:Java service.language.version:10.0.2 host.hostname:dev-docker01.healthplan.com

==Span document for parent.id:aaf4587b1ae10072==
parent.id:aaf4587b1ae10072 agent.name:java agent.version:1.5.0 process.pid:7,469 process.title:/usr/java/jdk-10.0.2/bin/java process.ppid:7,040 processor.name:transaction processor.event:transaction url.path:/api/cars url.scheme:http url.port:8,080 url.domain:10.40.33.180 url.full:http://10.40.33.180:8080/api/cars observer.hostname:dev-docker01 observer.id:4676ae72-8f2d-438f-8dbe-e591333f1b5c observer.ephemeral_id:9955085b-a08e-4a59-8a5f-a68e41978632 observer.type:apm-server observer.version:7.0.0 observer.version_major:7 trace.id:ac2a4ef3c9741acb8bb9a9e22eb78b26 @timestamp:May 8, 2019 @ 09:26:22.446 ecs.version:1.1.0-dev service.name:cardatabase service.runtime.name:Java service.runtime.version:10.0.2

==frontend document==
May 8, 2019 @ 09:26:22.761 trace.id:ac2a4ef3c9741acb8bb9a9e22eb78b26 processor.event:transaction transaction.id:f142337f6b4bfd8b observer.hostname:dev-docker01 observer.id:4676ae72-8f2d-438f-8dbe-e591333f1b5c observer.ephemeral_id:9955085b-a08e-4a59-8a5f-a68e41978632 observer.type:apm-server observer.version:7.0.0 observer.version_major:7 agent.name:js-base agent.version:3.0.0 @timestamp:May 8, 2019 @ 09:26:22.761 ecs.version:1.1.0-dev service.name:carfront service.language.name:javascript service.version:0.90 client.ip:10.30.33.83 processor.name:transaction transaction.duration.us:597,790 transaction.name:Car List transaction.span_count.started:5 transaction.marks.agent.timeToFirstByte:23

@Eyal_Koren, any advice you can provide to resolve this? Looks like it might be UI issue since required data (such as trace.id and parent.id are there). However, as said in the previous posts, not able to find separated timelines (or response time) for carfront and cardatabase (backend) on kibana. What can see now on kibana is the whole timeline under carfront.

Being able to get separated timelines is quite important since this is the promise of the distributed tracing (to understand the behavior for each party participating in the whole call chains of the ecosystem).

thanks.

Jia

Sorry for the delayed response...

In fact, there is still a document missing. I think your search for parent.id= id:aaf4587b1ae10072 just found the cardatabase transaction again. The question is whether there is a Span sent by the RUM agent with span.id=id:aaf4587b1ae10072. If there isn't, distributed tracing chain will be broken.

In addition, we need to figure out why you can't see the cardatabase service at all. Did you mean you can't see it always, or you can't see it when filtering for the given trace.id?

thanks.

Rerun the carList app. I can get the result from Discover with Filters as parent.id: fe4d8bc2d1a59f38 (where fe4d8bc2d1a59f38 is supposed to be span Id as you described in your previous reply). However, if putting span.id: fe4d8bc2d1a59f38 in the Filters field and doing a new search, I am not getting any results back. I did another wildcard search with span.id: *, this time, I got the results. But none of them containing fe4d8bc2d1a59f38. Copying the wildcard search results below for your info.

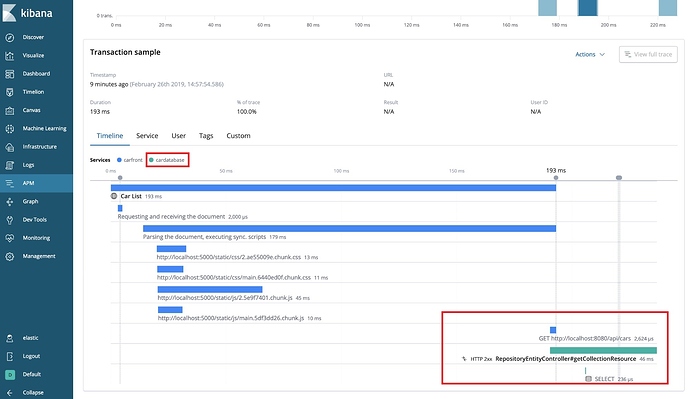
To clarify, we can see both carList (front side) and carDatabase separately without issues. The issue is that we are not able to see the distributed tracing. To help you understand about what I meant not seeing the distributed tracing, I am attaching a jpg (taken from the original blog). There are two areas marked with rectangular frame in red color. These two are supposed to part of the distributed tracing that we are not able to get.

===wild card span id search results===
May 13, 2019 @ 11:02:12.891 observer.hostname:dev-docker01 observer.id:4676ae72-8f2d-438f-8dbe-e591333f1b5c observer.ephemeral_id:9955085b-a08e-4a59-8a5f-a68e41978632 observer.type:apm-server observer.version:7.0.0 observer.version_major:7 parent.id:6cc1f769995bf65f agent.name:js-base agent.version:3.0.0 trace.id:46be5d15f3fabe4717fe5aa886beec54 @timestamp:May 13, 2019 @ 11:02:12.891 ecs.version:1.1.0-dev service.name:carfront processor.name:transaction processor.event:span transaction.id:6cc1f769995bf65f timestamp.us:1,557,759,732,891,352 span.duration.us:792,344 span.start.us:317,315 span.name:http://10.40.33.180:8000/static/js/0.chunk.js span.http.url.original:http://10.40.33.180:8000/static/js/0.chunk.js span.action:NA span.id:72926d0dbe055152 span.type:resource _id:Myu3sWoBBimRP_kxL6Ni _type:_doc _index:apm-7.0.0-span-2019.05.13 _score: -

May 13, 2019 @ 11:02:12.891 parent.id:6cc1f769995bf65f observer.hostname:dev-docker01 observer.id:4676ae72-8f2d-438f-8dbe-e591333f1b5c observer.ephemeral_id:9955085b-a08e-4a59-8a5f-a68e41978632 observer.type:apm-server observer.version:7.0.0 observer.version_major:7 trace.id:46be5d15f3fabe4717fe5aa886beec54 agent.name:js-base agent.version:3.0.0 @timestamp:May 13, 2019 @ 11:02:12.891 ecs.version:1.1.0-dev service.name:carfront processor.name:transaction processor.event:span transaction.id:6cc1f769995bf65f span.duration.us:190,515 span.name:http://10.40.33.180:8000/static/js/main.chunk.js span.start.us:317,700 span.action:NA span.http.url.original:http://10.40.33.180:8000/static/js/main.chunk.js span.id:4489fbf3b9ceb60d span.type:resource timestamp.us:1,557,759,732,891,737 _id:NCu3sWoBBimRP_kxL6Ni _type:_doc _index:apm-7.0.0-span-2019.05.13 _score: -

May 13, 2019 @ 11:02:12.890 parent.id:6cc1f769995bf65f observer.hostname:dev-docker01 observer.id:4676ae72-8f2d-438f-8dbe-e591333f1b5c observer.ephemeral_id:9955085b-a08e-4a59-8a5f-a68e41978632 observer.type:apm-server observer.version:7.0.0 observer.version_major:7 trace.id:46be5d15f3fabe4717fe5aa886beec54 agent.name:js-base agent.version:3.0.0 @timestamp:May 13, 2019 @ 11:02:12.890 ecs.version:1.1.0-dev service.name:carfront processor.name:transaction processor.event:span transaction.id:6cc1f769995bf65f span.duration.us:139,889 span.name:http://10.40.33.180:8000/static/js/bundle.js span.start.us:316,825 span.http.url.original:http://10.40.33.180:8000/static/js/bundle.js span.action:NA span.id:6ade35cf535b4f2e span.type:resource timestamp.us:1,557,759,732,890,862 _id:Miu3sWoBBimRP_kxL6Ni _type:_doc _index:apm-7.0.0-span-2019.05.13 _score: -

May 13, 2019 @ 11:02:12.610 parent.id:6cc1f769995bf65f observer.hostname:dev-docker01 observer.id:4676ae72-8f2d-438f-8dbe-e591333f1b5c observer.type:apm-server observer.ephemeral_id:9955085b-a08e-4a59-8a5f-a68e41978632 observer.version:7.0.0 observer.version_major:7 trace.id:46be5d15f3fabe4717fe5aa886beec54 agent.name:js-base agent.version:3.0.0 @timestamp:May 13, 2019 @ 11:02:12.610 ecs.version:1.1.0-dev service.name:carfront processor.name:transaction processor.event:span transaction.id:6cc1f769995bf65f timestamp.us:1,557,759,732,610,037 span.duration.us:264,000 span.start.us:36,000 span.name:Requesting and receiving the document span.action:NA span.id:dc40f7fcbc3815a7 span.type:hard-navigation _id:MSu3sWoBBimRP_kxL6Ni _type:_doc _index:apm-7.0.0-span-2019.05.13 _score: -

May 13, 2019 @ 11:02:12.578 parent.id:6cc1f769995bf65f observer.hostname:dev-docker01 observer.id:4676ae72-8f2d-438f-8dbe-e591333f1b5c observer.ephemeral_id:9955085b-a08e-4a59-8a5f-a68e41978632 observer.type:apm-server observer.version:7.0.0 observer.version_major:7 agent.name:js-base agent.version:3.0.0 trace.id:46be5d15f3fabe4717fe5aa886beec54 @timestamp:May 13, 2019 @ 11:02:12.578 ecs.version:1.1.0-dev service.name:carfront processor.name:transaction processor.event:span transaction.id:6cc1f769995bf65f span.duration.us:32,000 span.name:Making a connection to the server span.start.us:4,000 span.action:NA span.id:d56a14a8993b09c0 span.type:hard-navigation timestamp.us:1,557,759,732,578,037 _id:MCu3sWoBBimRP_kxL6Ni _type:_doc _index:apm-7.0.0-span-2019.05.13 _score: -

May 13, 2019 @ 11:02:12.493 parent.id:2702014bffd58822 observer.hostname:dev-docker01 observer.id:4676ae72-8f2d-438f-8dbe-e591333f1b5c observer.ephemeral_id:9955085b-a08e-4a59-8a5f-a68e41978632 observer.type:apm-server observer.version:7.0.0 observer.version_major:7 agent.name:java agent.version:1.5.0 trace.id:46be5d15f3fabe4717fe5aa886beec54 @timestamp:May 13, 2019 @ 11:02:12.493 ecs.version:1.1.0-dev service.name:cardatabase processor.name:transaction processor.event:span transaction.id:2702014bffd58822 span.duration.us:3,962 span.subtype:h2 span.name:SELECT span.action:query span.id:e07e1dafd41bf83f span.type:db span.db.statement:select car0_.id as id1_0_, car0_.brand as brand2_0_, car0_.color as color3_0_, car0_.model as model4_0_, car0_.owner as owner8_0_, car0_.price as price5_0_, car0_.register_number as register6_0_, car0_.year as year7_0_ from car car0_ span.db.type:sql span.db.user.name:SA timestamp.us:1,557,759,732,493,868 _id:oCu3sWoBBimRP_kxVaMJ _type:_doc _index:apm-7.0.0-span-2019.05.13 _score: -
It seems that the span that made the AJAX call (the top GET span in the area you surrounded with a red frame) is missing, which explains why distributed tracing is not presented properly. This span would have the searched span.id. The cardatabase service Transaction points to this span as its parent (through the parent.id) as it should, because that's the information it received from the traceparent header.
So we need to see why this span was not reported.
Let us get back to you with further steps/queries.
Thanks for your patience!

Hi @jiawang,

I have reproduced this locally and it seems to be a bug in our example source code. I've made this PR to fix it.

Would you please try again with the changes in that pull request?

Cheers,
Hamid

Tried the fix of carList. don't see anything different in terms of trace correlation from last version. Still not able to see the distributed tracing on kibana.

Did the search with span.id: 37183e30ed4747a2 on kibana Discover view after running carFront and no results were returned. Did wildcard search as span.id:*, got 6 documents returned. But none of them has the span id = 37183e30ed4747a2.

Please advise. Thanks.

Have you tried accessing CarList from different browsers?

I cam across a weird problem myself.
I used to have my own Node + Java application that is fully instrumented with Elastic APM (The Node app has RUM). I enabled Distributed Tracing and it worked very well.

A week ago, I noticed that Distributed tracing stopped working. The web part is captured, and so are the backend calls; but they are not correlated. I reinstalled my apps, updated the agent versions, reinstalled my ELAK stack... to no avail. Today, I decided on a whim to test my app on Firefox and Safari... distributed tracing worked.

Looking at the Dev tools, I noticed that with Firefox, an extra 202 response is received after a POST of the RUM agent. In Chrome, there is no post call. Both instance show the elastic-apm-traceparent header and value so the agent does work on both. The only question is why the POST never happens in Chrome (which it did in the past).

Not sure if this is simply a Chrome issue but I'm digging further.

thanks for your comments.

Using firefox doesn't make any difference (still no correlation) in our case.

@Eyal_Koren & @Hamidreza, can you please advise further to resolve this issue? Thanks.

Hi @jiawang,

Sorry about the slow response.

Would you please add debug: true to rum.js file, something like:

var apm = initApm({
   ...
  debug: true
})

And post your console logs here.

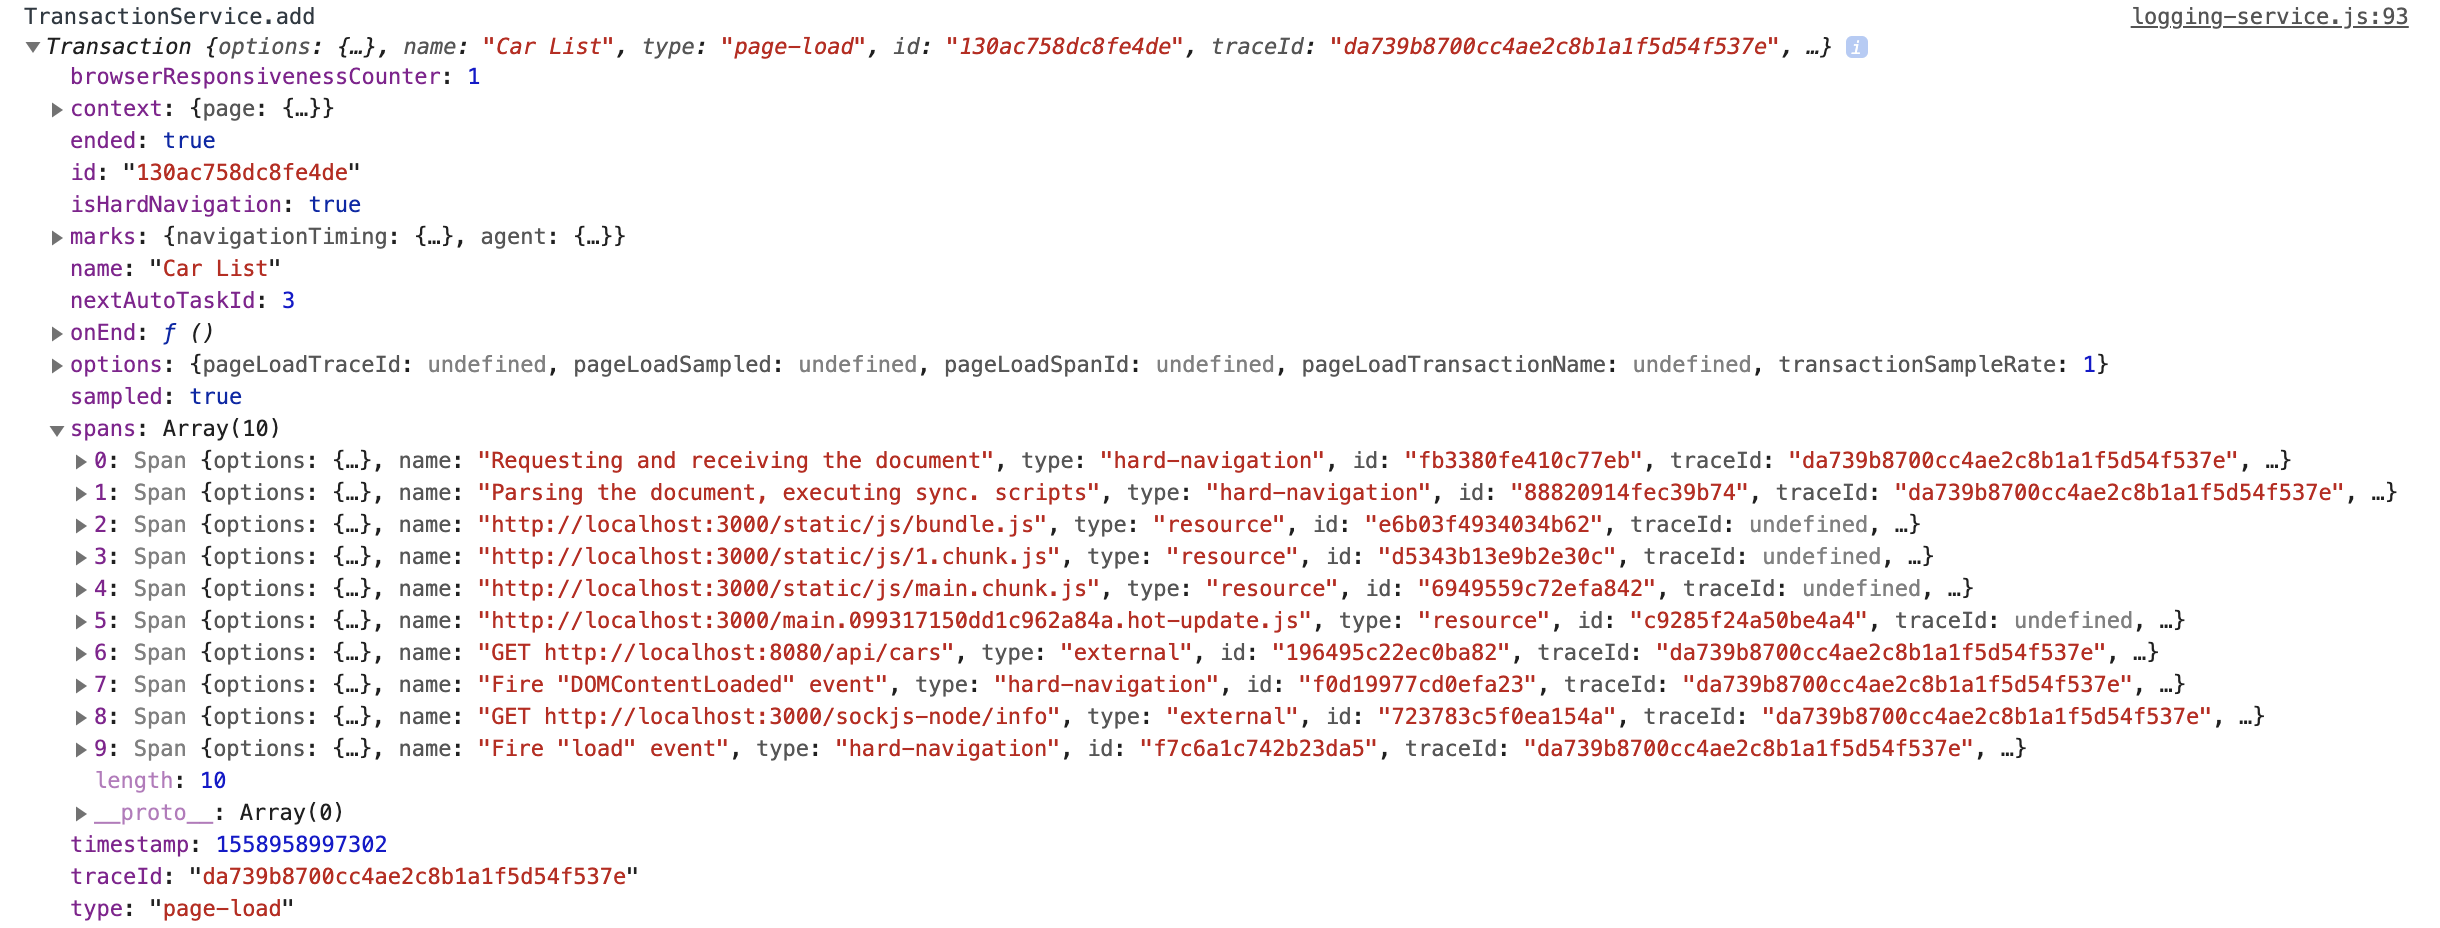
As a reference, I see the following:

image

Which shows that GET http://localhost:8080/api/cars span is sent in the spans of the page-load transaction.

Cheers,
Hamid

thanks @Hamidreza. I turned on debug as your instruction. Attached is the screen capture of part of the console outputs. It appears that the span info from GET http://localhost:8080/api/cars is not shown in the console. This might indicate that the js rum agent doesn't send this span data to APM server.

for your reference, copy rum.js below.

===========rum.js============
var apm = initApm({
serviceName: 'carfront',
serviceVersion: '0.90',
serverUrl: 'http://10.40.33.180:9000',
distributedTracingOrigins: ['http://10.40.33.180:8080'],
debug: true,
})

@Hamidreza & @Eyal_Koren: Any further advice that can help us to fix this issue and make the CarList sample working at our side? Thanks

@jiawang Seems like you you might have missed some steps from the suggested fix, This is before and after of the fix

Before

After

I hope you went through the below steps to get it working

  1. Replace Cartlist.js with the code from the PR - https://github.com/adamquan/carfront/blob/ff39ca9647336d85b342f71a40fe7f031c2ef3cb/src/components/Carlist.js
  2. Run npm run build again.
  3. Run server -s build
  4. Check console for the spans with debug: true

I am not sure if i am helping, I have asked the author to merge the PR as well. Please let us know if you still see the issue.

Thanks,
Vignesh

Hello, Thanks all. This sample (carList) is now working at our end.