Created a moving average visualization using TSVB, Since Y-Axis is generated large number scale value small digit number is marked on top of the '0' line. So difficult understand the analysis.
In this screenshot, both green and blue line value was around below 200, even though it was marked in 0 position of y-axis.
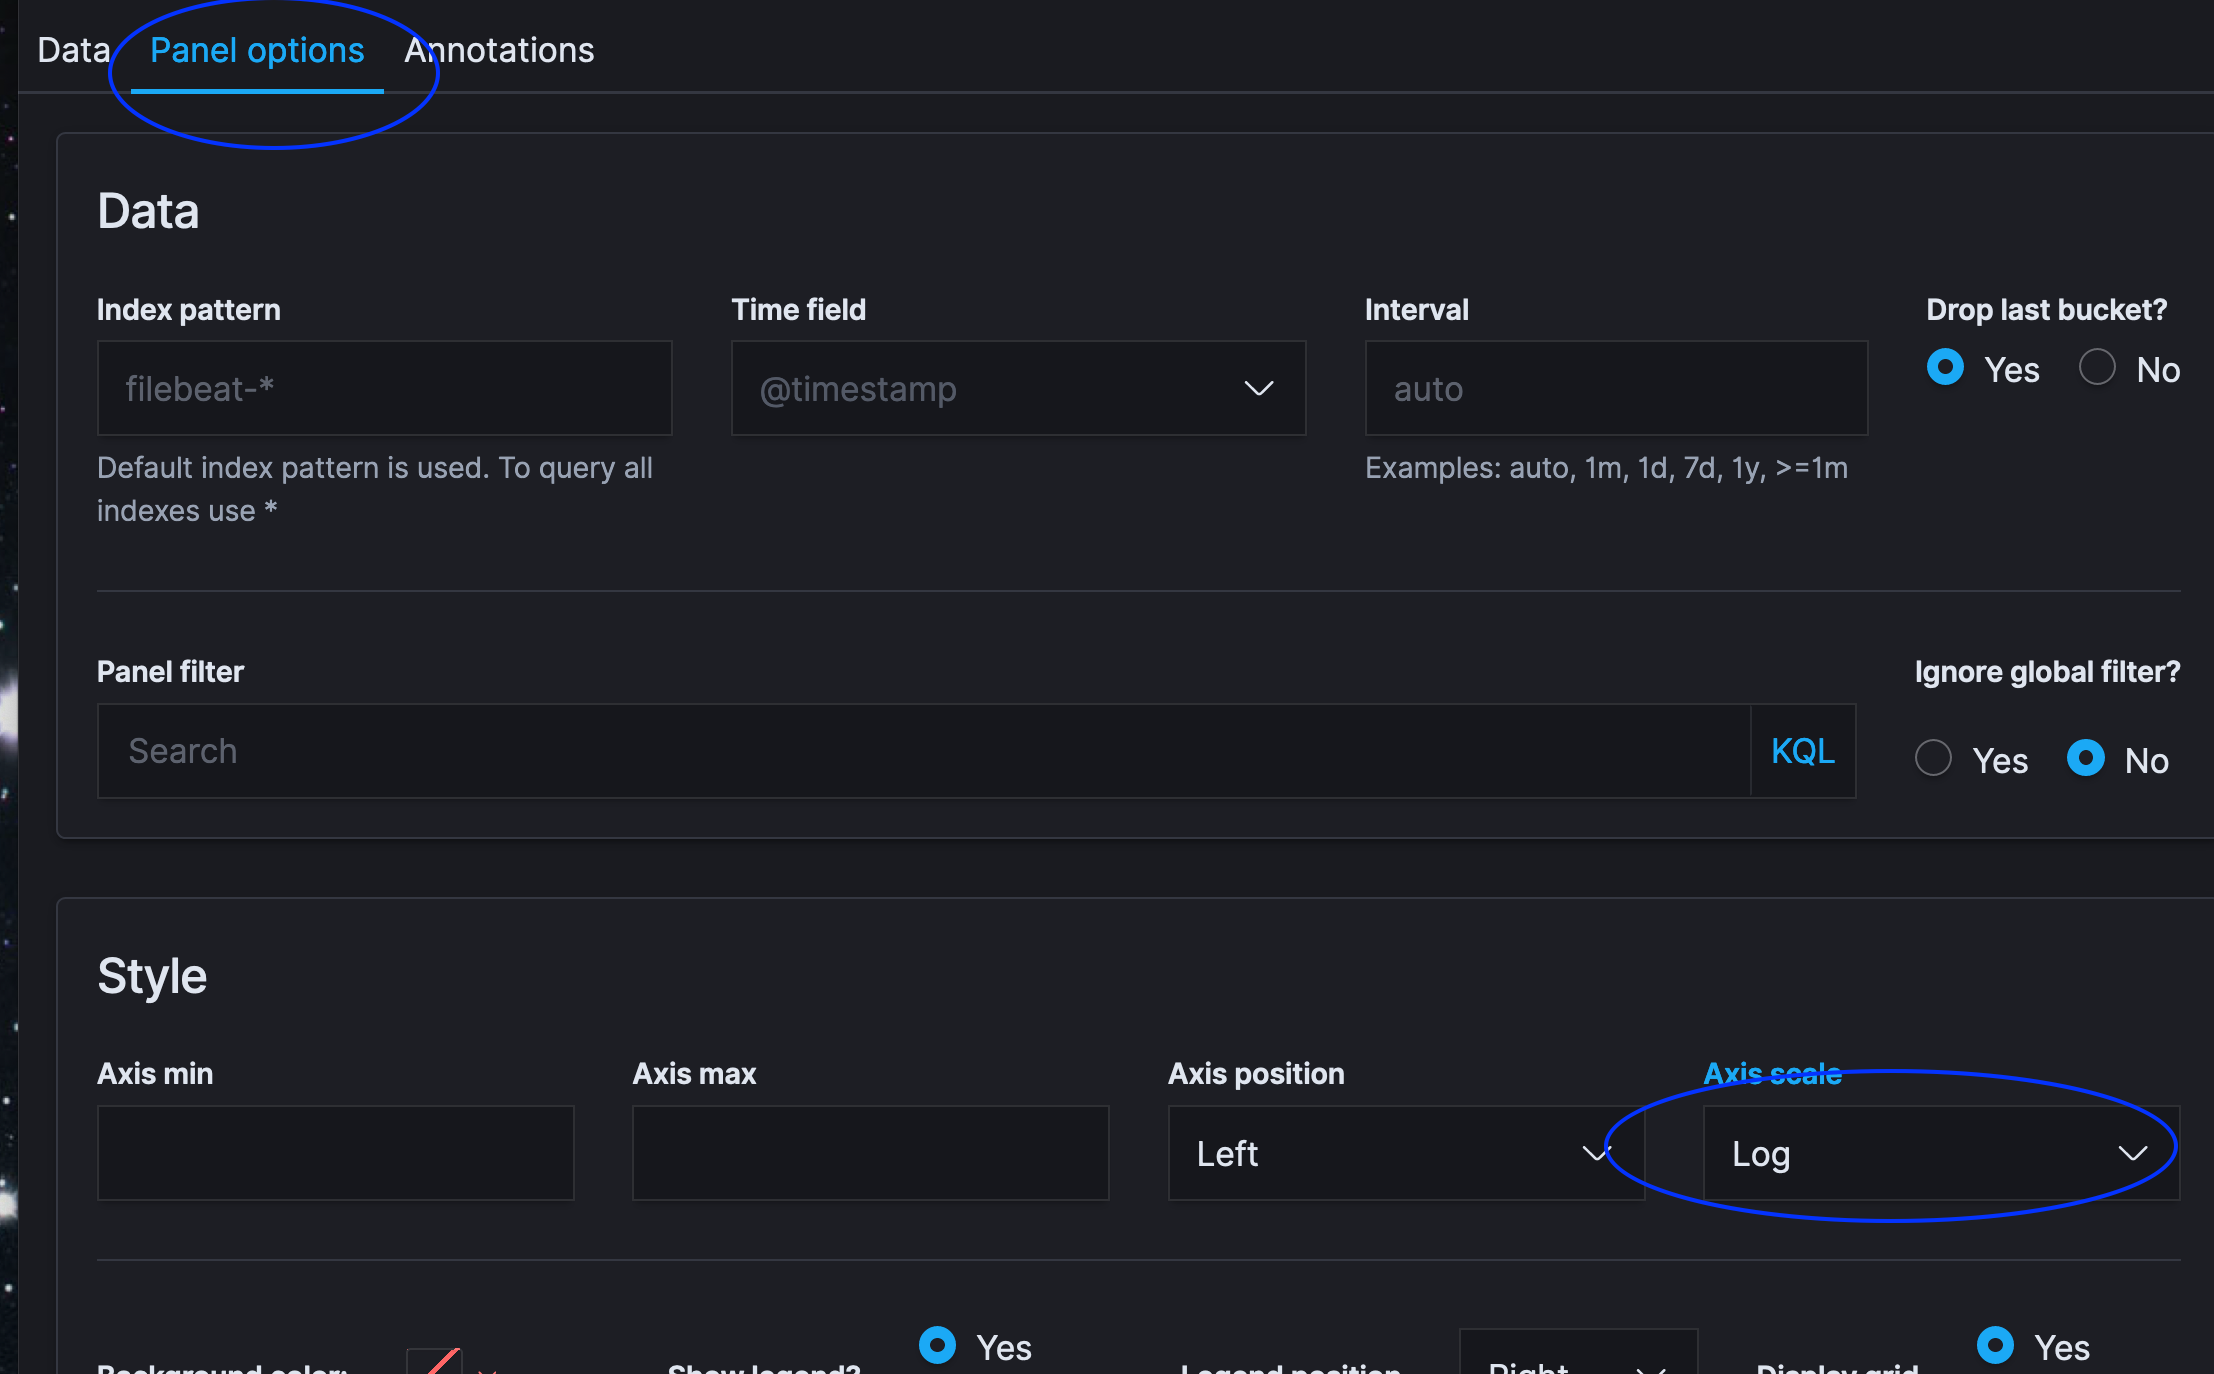
How can we change the scale type to log as we do it in the BAR charts or anyother alternative option to bring up those line in the correct position.