We have Node JS (Nest JS / Express) - based application services on the GCP cloud.
We are using Elasticsearch to support full-text search on a blog/news website.
Our requirement is to support 2000 reads per second minimum.
While performing load testing, we observed that until a concurrency of 300 is reached, Elasticsearch performs well and response times are acceptable.
CPU usage also spikes under this load. But, when the load is increased to 500 or 1000, CPU usage drops, and response times increase drastically.
What we don't understand is, why our CPU usage is 80% for a load of 300 and just 30 ~ 40% when load increases. Shouldn't CPU pressure increase with load?
What is the right way to tune Elasticsearch for read-heavy usage? (Our write frequency is just 1 document in 2-3 hours)
We have one single index with approx 2 million documents. The index size is just 6GB.
Elastic cluster is deployed on Kubernetes using helm charts with:
That is a quite small and manageable data set so make sure that the index has a single primary shard and that the number of replicas is set so that all data nodes hold a copy.
Sounds like you are already doing what I just recommended.
The default settings are generally very good, so changing that should be a last resort.
This sound very little. The key to optimal read performance is generally to try to eliminate disk IO, as this is a lot slower than serving from memory. Elasticsearch relies a lot on the operating system page cache for optimal performance.
I would recommend increasing the heap size to 2GB and the amount of RAM available to the node to 10GB, as this should allow the complete index to fit in the page cache. If you still see disk IO, you can increase the amount of RAM a bit more. If you see long or frequent GC you may also want to increase the heap size.
If CPU now becomes the bottleneck you may want to increase this as well.
Once this is done and you are able to support your query throughput you can slowly reduce resources as long as performance remain good enough.
If you are looking for any kind of high availability you need to have 3 master eligible nodes in the cluster.
I would recommend sending queries directly to the data nodes, but if you use a coordinating only node - make sure this does not befome a bottleneck. If you only have 1 it is also a potential single point of failure...
We setup a new cluster with following configurations:
Removed coordinating node
3 Master eligible nodes
CPU: 250m
RAM: 512 MB
HEAP: 256MB
4 Dedicated data nodes
CPU: 1
RAM: 5 GB
HEAP: 2 GB
We ran load test with 300 / 500 / 1000 concurrency and following are observations:
Avg response time with 300 load - 950ms
Avg response time with 500 load - 950ms
Avg response time with 1000 load - 1800ms
On master node:
max CPU usage goes upto 0.195m
max RAM usage stays contand around 400MB
On data node:
max CPU usage under load is 0.47m
max RAM usage under load goes to 2.6GB
This data is based on GKE dashboard metrics where we are running elasticsearch cluster.
Index is not sharded and has 3 replicas.
I still dont understand where bottlenext could be as no nodes are using using allocated resources completely. Performance has infact dropped compared to previous setup. In earlier setup, we got avg response time of < 500ms for 300 load.
For optimal read performance it is ideal that the whole index fits in the operating system page cache. I would recommend setting up a single node with the following specification and load the index there:
CPU: 2
RAM: 10GB
HEAP: 2GB
Assuming your index is 6GB in size I believe it should fully fit into the RAM available to the page cache.
Once this is ready, start running your benchmark at a low concurrency level and step-by-step increase it. Start with just 10 concurrent queries and then step up until you breach the latency you want to meet.
While you are increasing concurrency, monitor CPU usage and look for evidence of long or frequent GC. If you see very high CPU - try increasing this. If you see lots of GC, try to increase RAM and heap. If the full index sits in the cache you should also see very little disk IO, so it is worth looking at that too.
Once we know how a single node behaves with your data and queries we can look at how to best set up a cluster to reach your query throughput targets at acceptable latencies.
It was getting difficult to identify correct bottleneck so we got rid of coordinating nodes as well as dedicated master eligible nodes as well.
In current setup we have 2 nodes which are equivalent with no dedicated role assigned.
(I know this is not HA setup but our main focus is increasing reads at the moment)
Each node has 2 CPUs and 10GB RAM with heap size of 2048 MB.
Load testing setup is still same and response times have actually deteriorated with same size of data and similar queries.
CPU usage is still at 25%.
Elastic search cluster is setup using bitnami helm chart on kubernetes cluster with thread pool config at default values.
How did latencies change with increased concurrency? Can you share the results? Did you run the benchmarks I suggested?
Elasticsearch is often limited by disk I/O, not CPU, which is why I suggested trying to make sure the full data set can fit in the page cache. Have you verified that this is the case and that disk IO is not a bottleneck?
Are you sure Elasticsearch is getting access to the resources that it has configured? Sometimes CPU and/or RAM is overprovisioned this type of infrastructure, which can affect performance.
Since cluster is on kubernetes, I am not 100% sure that cluster is access to allocated resources. However, we eventually need to have cluster in kubernetes so will have to handle that as well if it is the real issue.
Are any of the above metrics concerning? Also, these are metrics from one node. I also did notice that performance was better with 2 nodes. With addition of 3rd node and additional replica, performance actually worsened
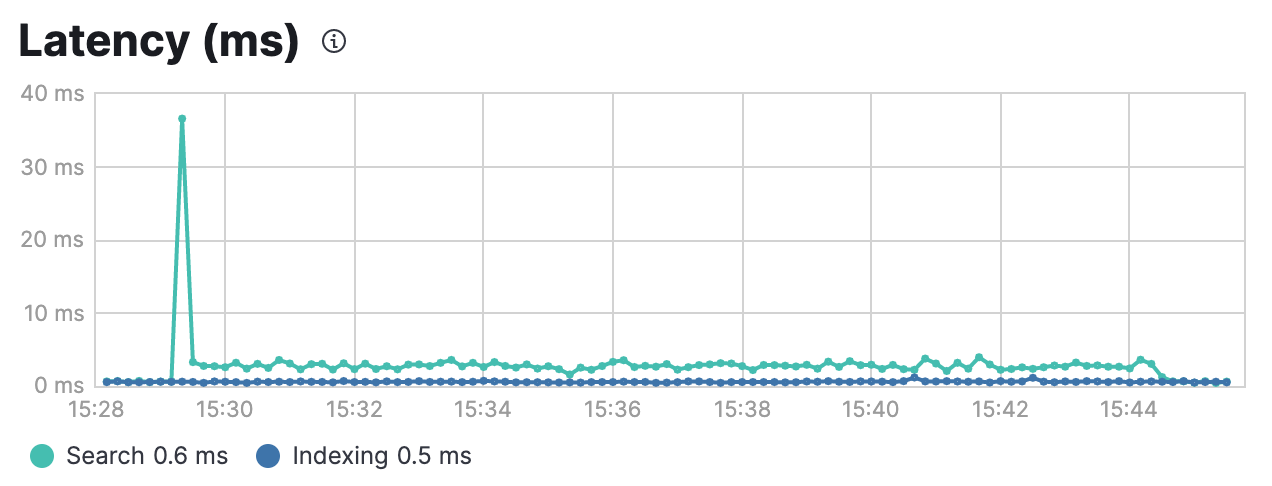
That all looks good. It does indeed look like the full index fits in the page cache, which is great. How many queries per second were you able to serve from a single node without exceeding the SLA? Did you ensure the queries were realistic?
You mean if the queries are well structured and optimised? I would say yes to a great extent.
We have a single index on which we are performing full text search. Though there are 5 - 7 different fields on which search are performed like tags, category, subcategory, author, company name, title, description, etc since it is a news website so search queries arent very complex.
We have created static mapping of fields on index and only fields which are to be matched in query are indexed. In some cases, it is a combination of must and should statement.
I have found some suggestion based on which I am configuring a copy-to field to club and store all the above mentioned fields into one so that search request goes to single field (this should improve queries with "should" part).
Apache, Apache Lucene, Apache Hadoop, Hadoop, HDFS and the yellow elephant
logo are trademarks of the
Apache Software Foundation
in the United States and/or other countries.