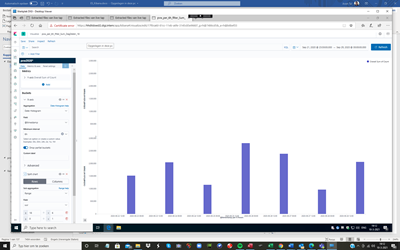
I want to select some columns of the following date histogram based on date range
e.g 18:00 daily

Added: The columns represent the sum of documents per 6 hour interval
See required result below
Thanks, Arieh Tal
I want to select some columns of the following date histogram based on date range
e.g 18:00 daily
Added: The columns represent the sum of documents per 6 hour interval
See required result below
Thanks, Arieh Tal
The easiest way to do this is to have a separate field in your index "hour_of_day" - then you can place a filter on this field in your visualization and the chart will show up as you expect.
The logs sample dataset has a scripted field for this purpose.
Dear Joe,
Sorry for the late reaction.
Where do I find the The logs sample dataset?
Of course I tried this method already by using a hour of day field but unfortunately the number of documents is wrong in the result compared to the 6 hour buckets [see below-counts are in millions]

I tried using the following filters:
Buckets
X-axis @timestamp per 6 hours
Split chart
Split chart by rows
Sub aggregation
Filters
Filter 1 “uur” is hour of day in dutch
uur: 0 [selected column is 18:00]

Counts are too low: on 22-09 should be 8.136.164
Second try: uur>=18

The counts are Ok now for the 22-09 but not for the rest!
I tried also using two conditions like uur >=18 and uur <=0 but no results.
I also saved the counts in an excel sheet if you want to have a look at them.
Thanks a lot, Arieh Tal
It depends on the Kibana version where exactly, but if you to to the Kibana "home" app (clicking the logo), there should be a link somewhere (search for "sample").
A common problem is time zones - the hour of day is different depending which time zone you use which can lead to confusing results, especially if a different time zone is used for the date buckets.
Can you share your script? How do you calculate uur?
uur is just a field in my indexes.
Thanks for the tip!!
uur is wrongly calculated! should be 23 not 1
timestamp:2020-09-28T23:29:59.987080Z @timestamp:Sep 28, 2020 @ 23:29:59.987 year:2,020 month:9 day:29 uur:1 minuut:29 seconde:59 microseconde:987,080 weekday:Tuesday
How should I use timestamp for this selection!
Best Arieh Tal
I can see now that there is one hour time difference between uur calculated and time stamp!
After adding one hour to the filtering it still doesn't give the right graphics?!
Is the problem using sum of counts?
How can I use timestamp filter selection using relative dates/times? as it's exepecting at least one absolute time in the range?
Thanks again Arieh
I'm not using a script but directly via visualize
This wouldn't do the trick, right? it's still wrapping at the wrong place and the actual hour 23 is saved as 0. I would recommend fixing this logic upstream, but to test you should be able to create a scripted field which takes the uur field, adds 23, then does modulo 24 (which is effectively subtracting 1)
How can I use timestamp filter selection using relative dates/times? as it's exepecting at least one absolute time in the range?
The timerange filter can work with relative dates just fine
Thanks a lot Joe, I'll try both recommendations.
Best Arieh
Dear Joe
I tried both solutions but unfortunately it doesn't seem to work?!
using script field

It takes for ever! is my script correct?
Using date range on timestamp
using one range gives the right result, see figure, but it's not general enough as I have to use the absolute date while using only the time of day will imply all dates which is what I want.

Anyway when I add another range only the last one is presented?!

My problem is that I want to select per time interval of 6 hours for any time window, which should work using filters.
e.g. using interval 06-12 hours for sept 26 to sept 29 so that I can follow the log data only for this time interval.
Best , Arieh
© 2020. All Rights Reserved - Elasticsearch
Apache, Apache Lucene, Apache Hadoop, Hadoop, HDFS and the yellow elephant logo are trademarks of the Apache Software Foundation in the United States and/or other countries.
