Hi there,
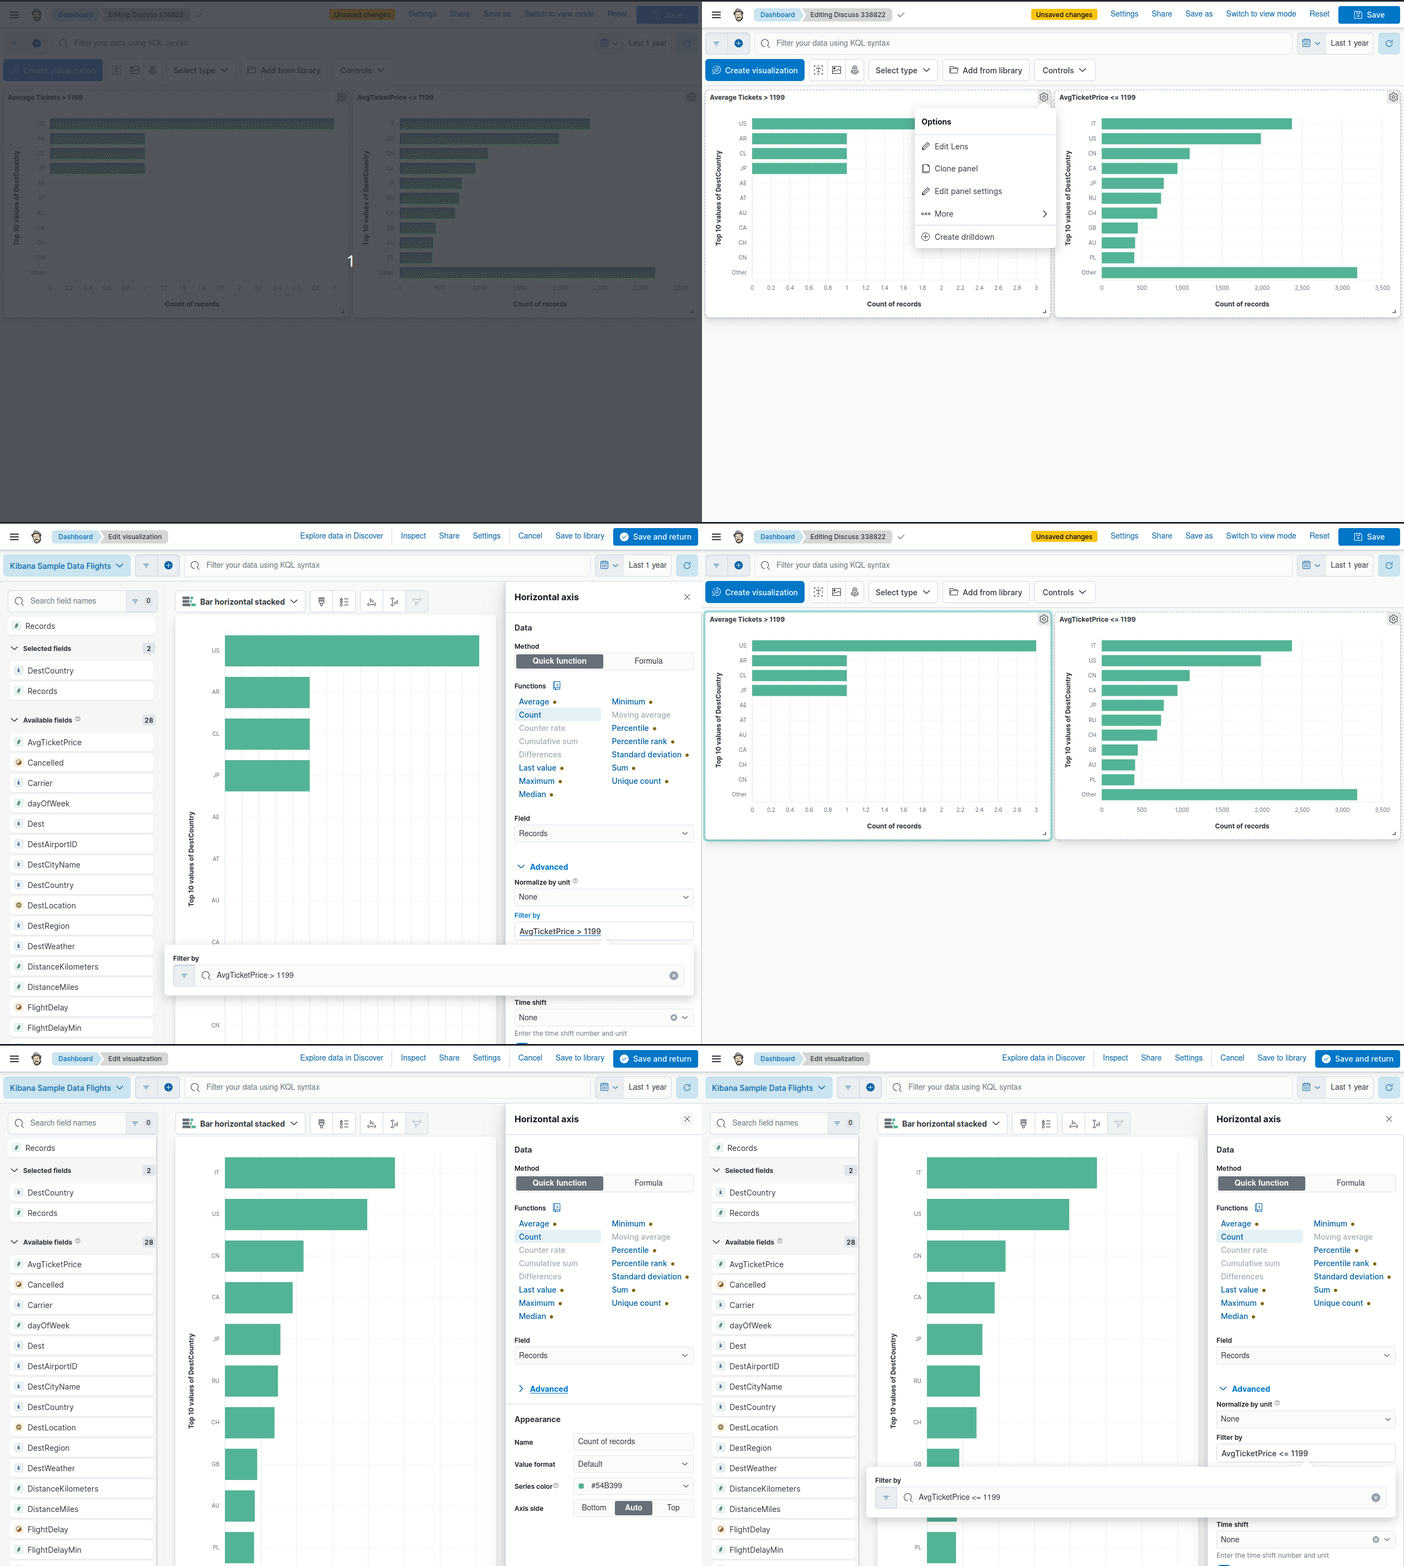
I made a stacked bar chart where the bars are sums of a duration field, each bar representing a day. The bars are split on field1. Some duration sums for some values of field1 much smaller in relation to others, so changes in their duration are not visible. Because of this, I would like to break the visualization out into one for durations greater than an hour, one for durations between 1 hour and 1 minute, and one for durations less than 1 minute. However, I don't see an option to filter the aggregated value. Is there anyway to accomplish this?
Thanks
