Hi,
We recently upgraded the OS on a couple of independently running hot/warm clusters. Each cluster has 9 nodes (3 masters, 3 hot nodes and 3 warm nodes) and are running on pretty decent hardware (32GB-64GB RAM on each node, terrabytes of storage and Intel Xeon processors). Both clusters are running Elasticsearch 7.4. The clusters has been running great for years, and as the EOL of Ubuntu 16.04 was getting close, we had to upgrade to Ubuntu 18.04.
Whats done:
- Upgraded from Ubuntu 16.04 to Ubuntu 18.04
- Elasticsearch was uninstalled during the upgrade, and reinstalled with the same Elasticsearch 7.4 version and the same config prior to the Ubuntu 18.04 upgrade.
- openjdk-8-jre-headless was upgraded to openjdk-11-jre-headless
It seemed to run perfectly fine for a few weeks, until we started to experience time-outs and a lot of backlog starting to pile up with e.g. shard allocations using 24 hours or more to move a shard from one node to another, or force merges never being completed.
It was very strange, as CPU and memory consumption was very low, but disk write speeds was as low as 20kbps per Elasticsearch thread according to htop. This affects all nodes in the cluster. Doing other tasks on the node while it was in this state was also extremely slow, like "apt update/apt install xyz" or similar.
I did a write speed test on our much smaller test cluster and compared to one of the clusters experiencing this problem:
root@node0101:~# dd if=/dev/zero of=/root/testfile bs=1G count=1 oflag=dsync
1+0 records in
1+0 records out
1073741824 bytes (1,1 GB, 1,0 GiB) copied, 1,18209 s, 908 MB/s

####

root@node0301:~# dd if=/dev/zero of=/root/testfile bs=1G count=1 oflag=dsync
1+0 records in
1+0 records out
1073741824 bytes (1,1 GB, 1,0 GiB) copied, 144,34 s, 7,4 MB/s
Here is a iotop screenshot of one of the clusters experiencing this problem:
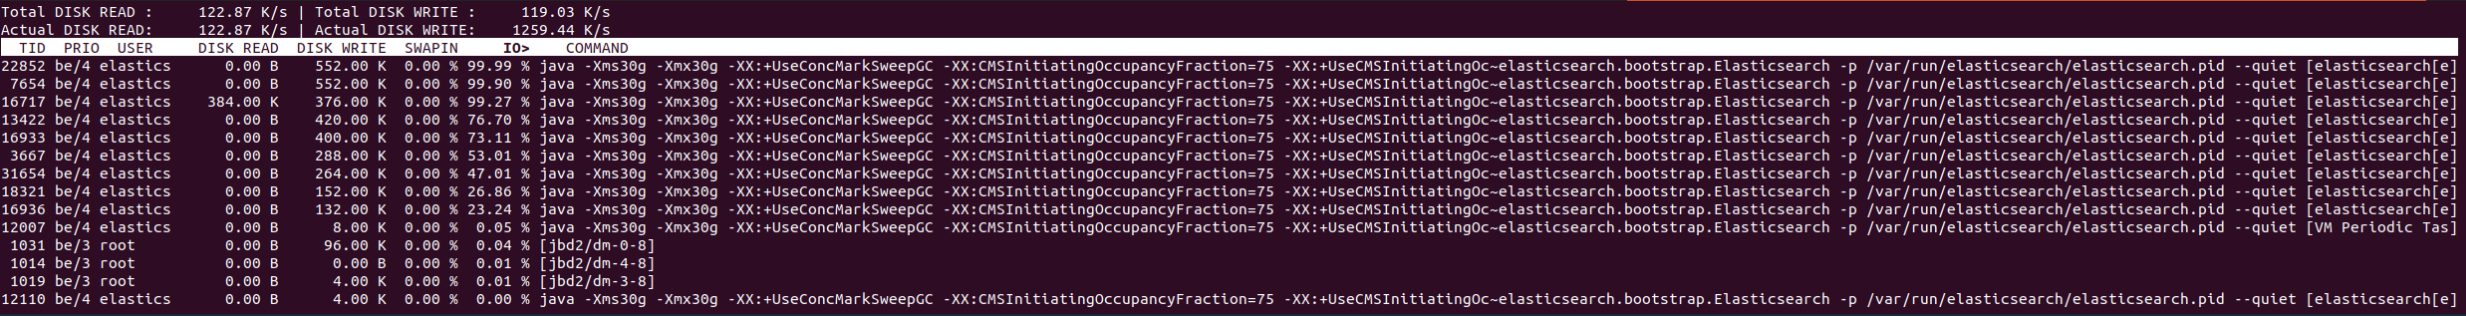
We temporarily solved it by restarting Elasticsearch on all nodes. After restarting Elasticsearch on a node, we would again get normal performance. This happens to two of our clusters, on completely separate hardware/location/networks. I expect this problem to show up again in a week or so.
Any suggestions on what to do next? Elasticsearch logs don't give me anything of interest (I think anyways).
Sincerely,
Adrian M