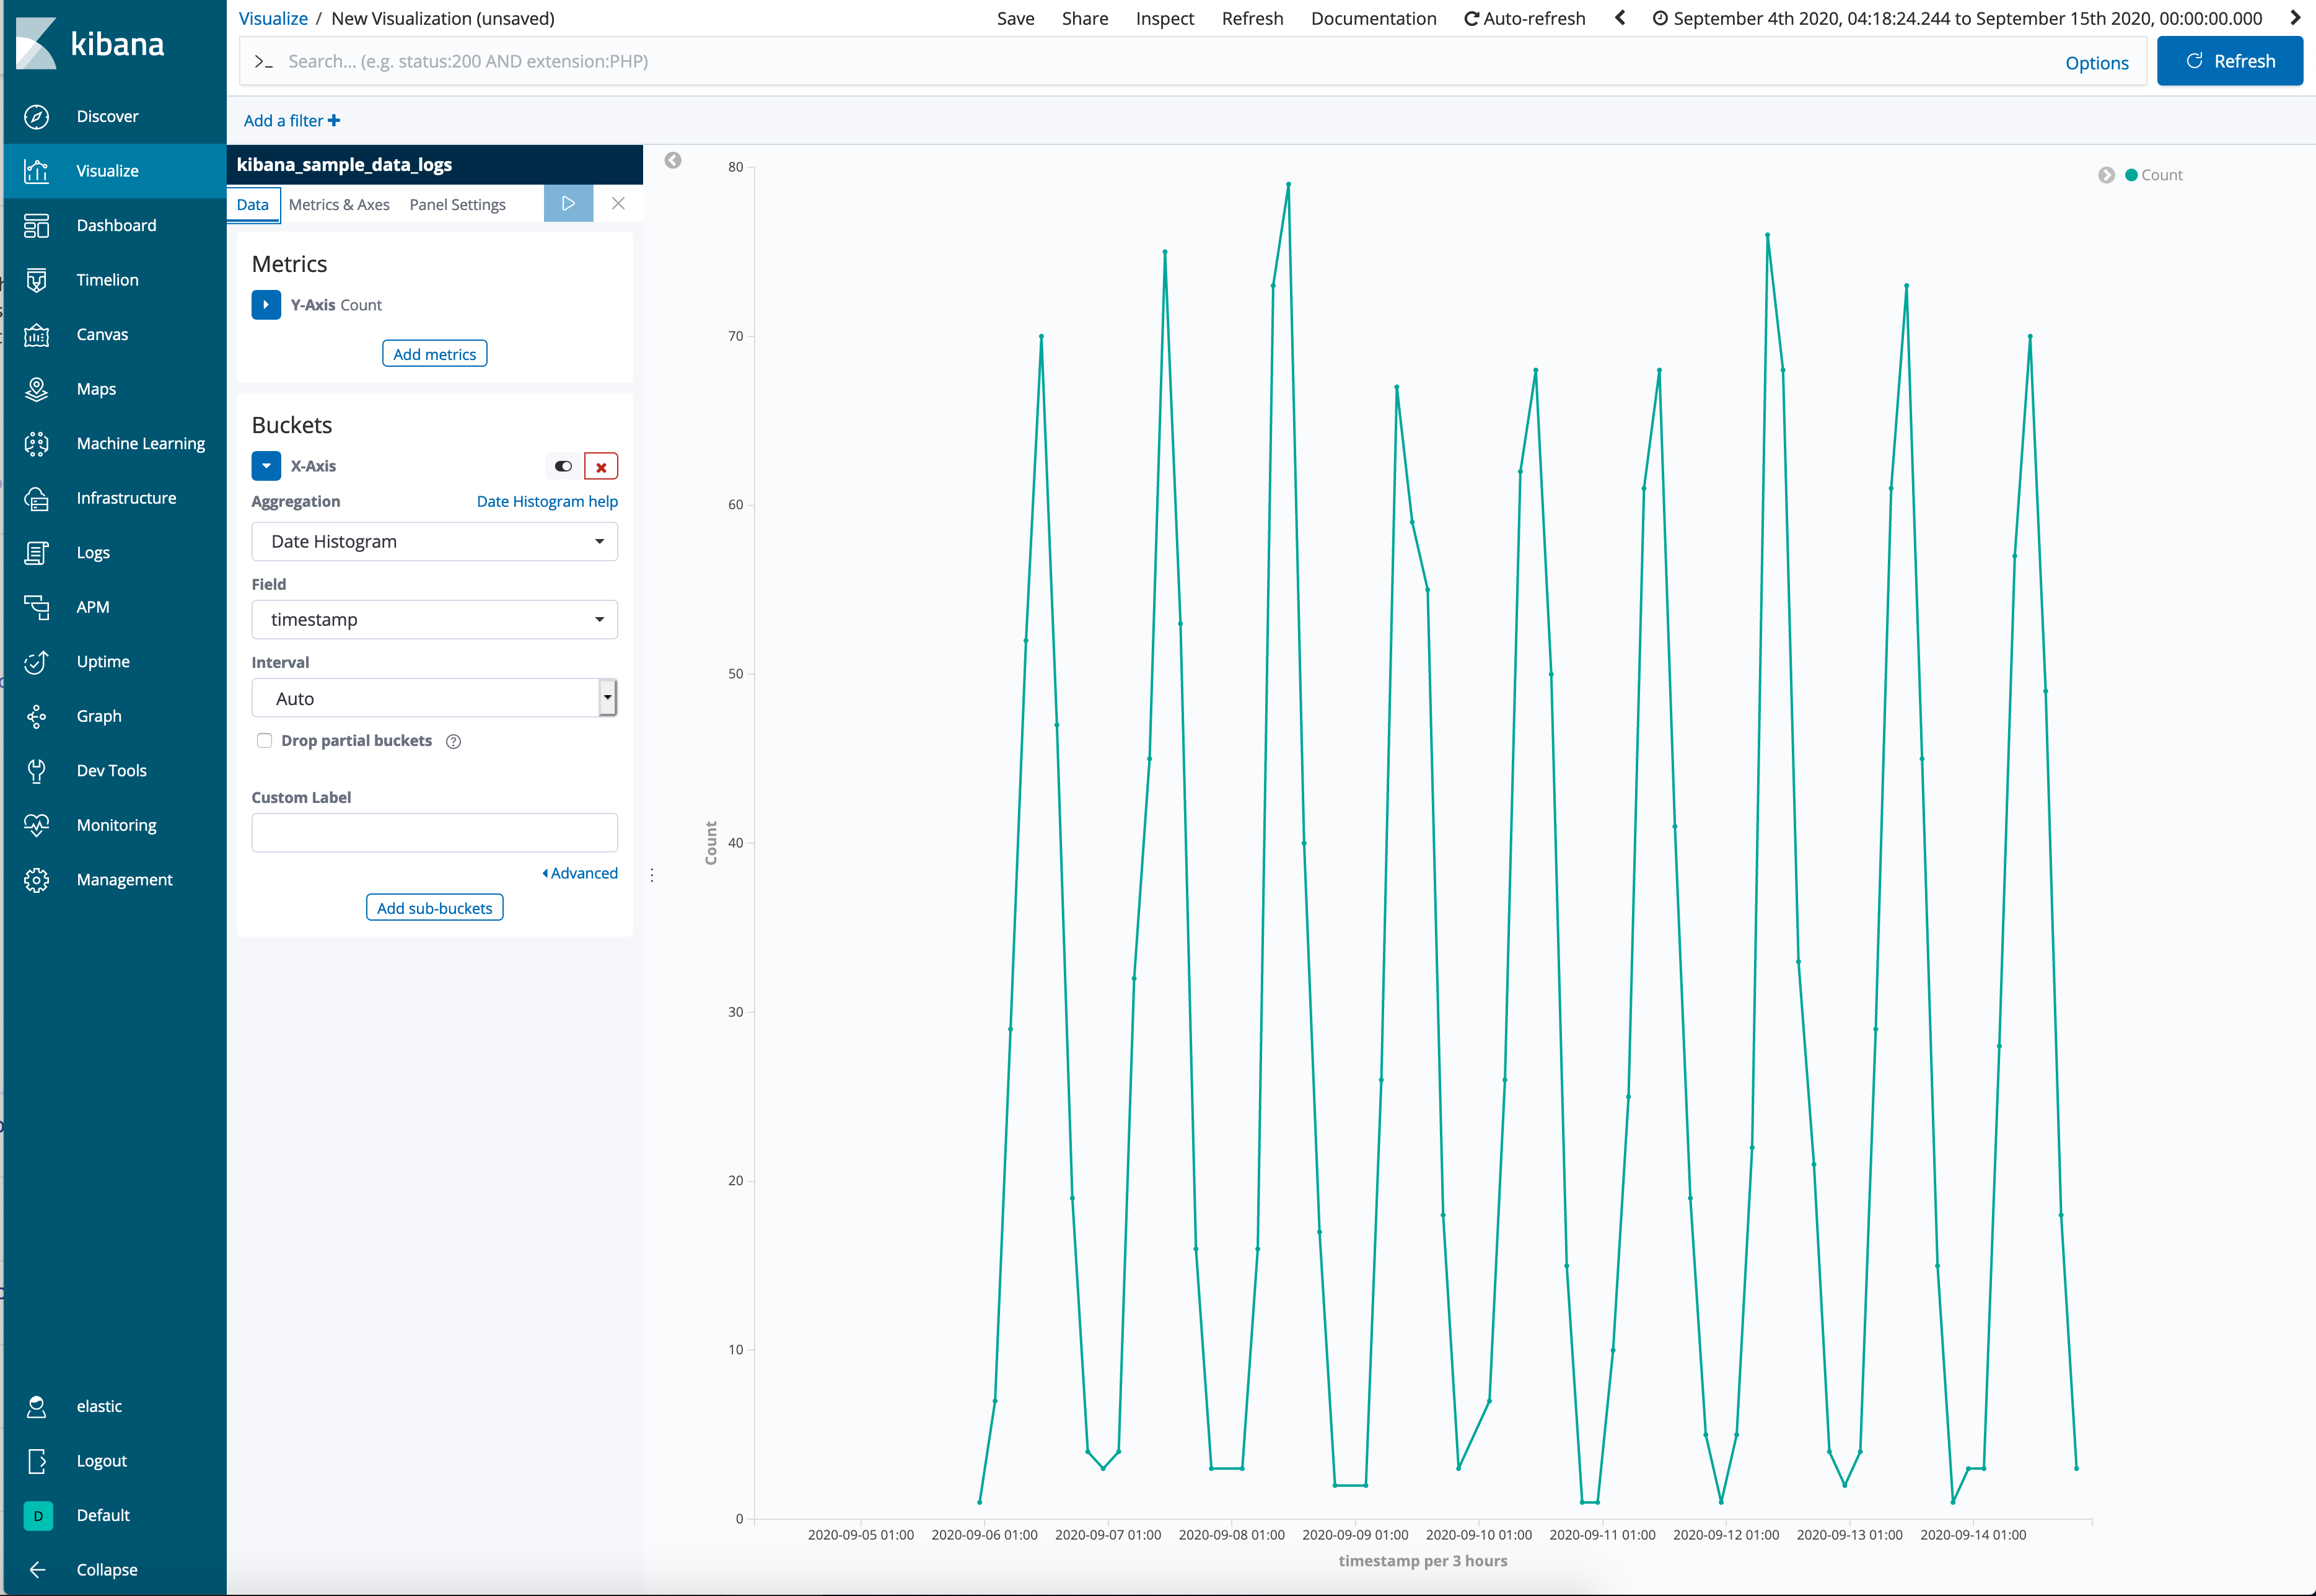
We have a line chart visualization to view occurrence over time. The time searched for can vary from hours to 10 years + so we are using the auto interval. Is it possible to pass the current setting of the auto interval to the label, or somewhere so the end-user can easily see it and understand what the graph is showing?
Spot on! Don't know why I didn't try that first! Is it possible to change the fieldName part without actually changing the field name? Just as the fieldName isn't as descriptive/user friendly?
Testing on 7.9, the visualisations created in Lens already take into account this issue. But I'm afraid there's no way to do so in 6.8. You can try replicating the same visualisations in Visual Builder. It just doesn't print the field name at all, only the interval
Apache, Apache Lucene, Apache Hadoop, Hadoop, HDFS and the yellow elephant
logo are trademarks of the
Apache Software Foundation
in the United States and/or other countries.