I have recently spent a lot of time getting a few of my data sources ingested in ECS format so that I can get the benefits from the SIEM capability. Some data comes direct from the *beats tools but some are via Logstash so I can do some conversion. This all seems to be working with no errors in the various tools - I have had many tweaks to make as Signals needed the data in a very specific format so as that is all working, I believe my data is in a good place.
Since adding more data, I have started to get errors on the Network page in the SIEM tool which are quite hard to debug so I have 2 questions.
Is there any way to get access to the SIEM dashboards? The network dashboard looks to have a number of visualisations but I can't find them to check what they are querying or to edit. This would help identify which visualisaiton(s) are causing the errors.
One of the visualisations is reporting that it is querying all indexes - even those that the SIEM is not supposed to query. I have added 1 custom index under Management > Advanced Settings > SIEM > Elasticsearch indices so it now reads:
The problem is that I am seeing queries to other indexes which I don't want queried on this dashboard or by SIEM at all. The images shown below show a query to a logstash-* index failure as there is no geo_point - this is not ECS formatted data yet so I don't expect it to work with SIEM. The second image shows a query to the .siem index - I don't know which visualisation would need to query that so also seems out of place?
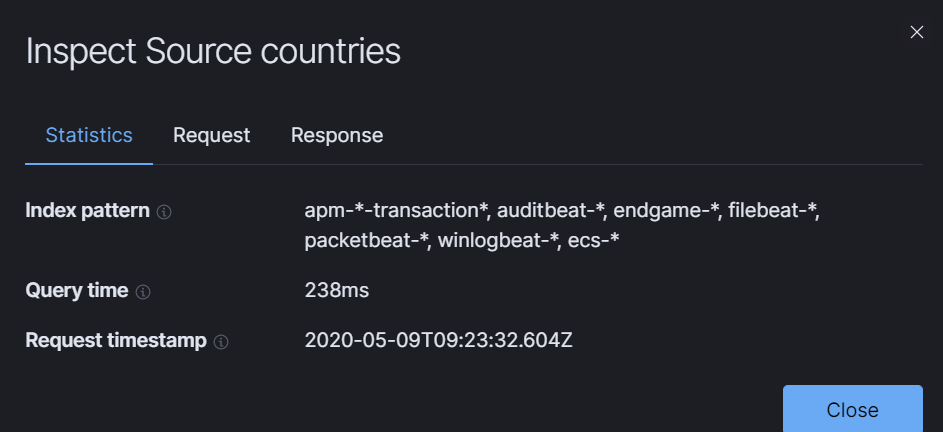
The shot below shows the data from Inspecting the Map on the Network page. This suggests there are queries to * which I am guessing may be where the problem lies as its querying all indexes? Again, without the ability to view the settings of the map visual, I don't know.
For your first question, we do not have any dashboard all the widget on the siem page have been build custom. However, you can inspect the query by clicking on the inspect button.
For number 2, you are correct with Management > Advanced Settings > SIEM > Elasticsearch indices. In there you should be able to add the indices that you want to apply in the SIEM app.
I will be curious if you can check the inspect button, and see that we are only querying for the indices that was set in the field above.
I have checked the data from the inspect option. On the typical visualisations it all looks fine so on the Network page, everything below the Map visual shows the correct index patterns - including my custom one which I have added.
If I inspect the Map, it appears to run 15 queries. The screenshot below shows the indexes it queries, not this includes *
While I appreciate it may be a bit of work, would it make more sense to open these charts up to the user to allow for optimisation? For all visualisations on the Network page, I do not see any need for them to query the winlogbeat, auditbeat or metricbeat indicies - my focus on network based communications would be all around the packetbeat, filebeat (because that ingests my Palo Alto FW data) and my custom index because I know they all include IP addresses.
As right now, we do not have this functionality. I will create an issue for a finer grained control/configuration over the index patterns. As right now, you can hide/show the index patterns on map's table of content.
Thanks for your help. Hiding the layers does stop the error but I need to browse to the page, hide the incorrect layers then refresh the time picker to re-run a query.
I appreciate you creating the issue, I think that makes sense.
Apache, Apache Lucene, Apache Hadoop, Hadoop, HDFS and the yellow elephant
logo are trademarks of the
Apache Software Foundation
in the United States and/or other countries.