Hi there,
I'm having index having 14M documents, occupying 1.6TB of pri.storage with 50shards.
There is query doing 22 aggregations (mainly simple terms aggs), took 0.3s.
I needed to add one sub-aggregation to every of those 22 aggs and execution time (took) grows to 5.3s.
This sub-agg is "cardinality" aggregation over field having ~1.15M distinct values (DOC_DEAL_NO)
      "uwrtYear" : {
        "terms" : {
          "field" : "content.ACCP_UWRT_YR.keyword",
          "order" : {
            "_key" : "desc"
          },
          "size" : 50
        },
        "aggs" : {
          "deals_count" : {
            "cardinality" : {
              "field" : "content.DOC_DEAL_NO.keyword"
            }
          }
        }
      }
Average times collected from "profile":true response:
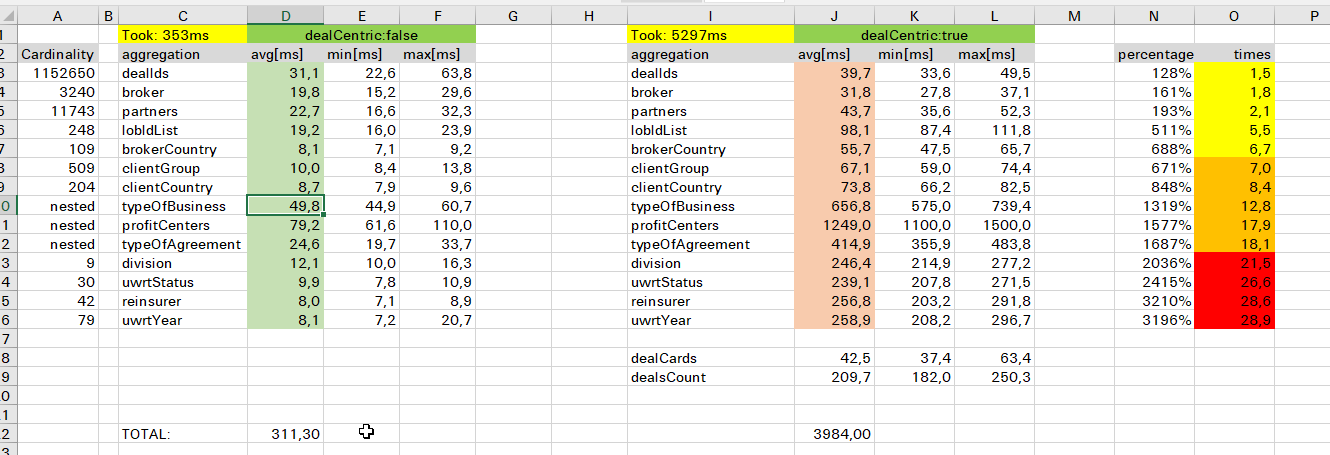
The most interesting fact is, that aggregations slowing down the request mostly are the ones, with low cardinality (at the end of the table - uwrtStatus, reinsurer, uwrtYear - column A)
Checking the "profile" part of the response, "collect" phase takes most of the time.
{
	"type": "GlobalOrdinalsStringTermsAggregator",
	"description": "uwrtStatus",
	"time": "257.2ms",
	"time_in_nanos": 257260689,
	"breakdown": {
		"reduce": 0,
		"post_collection_count": 1,
		"build_leaf_collector": 2930416,
		"build_aggregation": 1053952,
		"build_aggregation_count": 1,
		"build_leaf_collector_count": 36,
		"post_collection": 10203,
		"initialize": 584,
		"initialize_count": 1,
		"reduce_count": 0,
		"collect": 253265534,
		"collect_count": 184731
	},
	"debug": {
		"segments_with_multi_valued_ords": 0,
		"collection_strategy": "remap using single bucket ords",
		"segments_with_single_valued_ords": 36,
		"total_buckets": 26,
		"built_buckets": 1,
		"result_strategy": "terms",
		"has_filter": false
	},
	"children": [
		{
			"type": "CardinalityAggregator",
			"description": "deals_count",
			"time": "230.8ms",
			"time_in_nanos": 230810795,
			"breakdown": {
				"reduce": 0,
				"post_collection_count": 1,
				"build_leaf_collector": 1278362,
				"build_aggregation": 1033225,
				"build_aggregation_count": 1,
				"build_leaf_collector_count": 36,
				"post_collection": 8816,
				"initialize": 59,
				"initialize_count": 1,
				"reduce_count": 0,
				**"collect": 228490333,**
				"collect_count": 184731
			},
			"debug": {
				"ordinals_collectors_used": 32,
				"ordinals_collectors_overhead_too_high": 4,
				"built_buckets": 26,
				"string_hashing_collectors_used": 4,
				"numeric_collectors_used": 0,
				"empty_collectors_used": 0
			}
		}
	]
}
I have tried to apply "eager_global_ordinals": true for DOC_DEAL_NO, but no luck, still getting 5.3s response time.
Can anybody help with ideas, what else I can do/check to speed up it?
Thanks!
Dominik