Slow terms aggregation speed on ~130M documents

Environment:
ES version: 5.3
Data nodes: 3

We are trying to, through elasticsearch, provide users pregenerated suggestions based on the current dataset (130M documents). The target is to get all unique values of a certain field's property in a certain search. Let's say Field.Name.untouched.

Here is the query:

{  
    "query":{  
        "match_phrase":{  
            "_all":"tilapia"
        }
    },
    "_source":[  

    ],
    "size":0,
    "aggregations":{  
        "suggestions":{  
            "terms":{  
                "field":"Field.Name.untouched",
                "size":100
            }
        }
    }
}

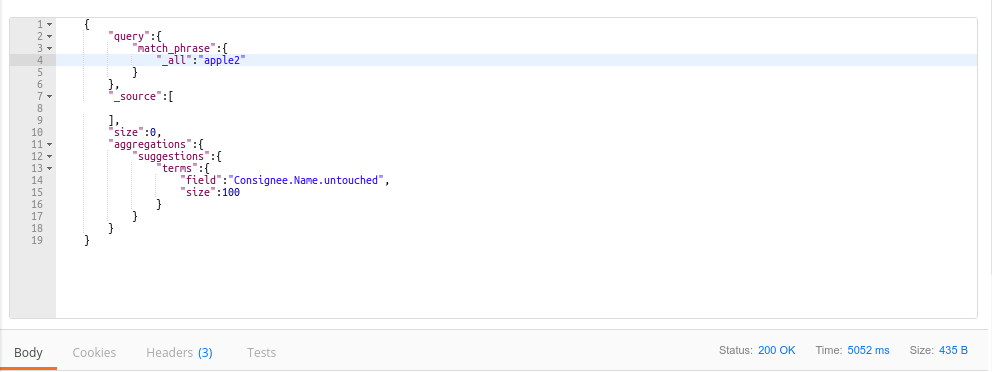
Which, on its own, takes around 4 seconds. Since the query only takes unique values with no additional processing done, shouldn't it take less time than this? For reference, the retrieved values have a total of 124019 documents, which is not really much. Additionally, it seems that the query time is consistently near 5 seconds regardless of the number of results which is weird. For reference, I tried an absurd keyword which only shows up twice (apple2) but it also took around 4 seconds.

Is there something wrong with our query?

P.S. I don't know if this is relevant to the problem but by removing the aggregation part, the search query takes around 200 and 300 ms which makes the 4-5s query time a lot weirder in my point of view.

Is it still the case after some runs?
Do you have a lot of distinct values?

What happens if you remove the terms agg size parameter?

Edit: Repeating the query leads to querying which makes the next query take around 200ms. My concern is the initial search though, which by resetting the cache each search consistently shows 4-5s.

Removing the size parameter seems to improve the speed by around 500ms and 1000ms, which means the total time is still around 4 and 5 seconds.

As I have said in the main post, I have a case where there are only 2 documents, with 2 unique values but it still takes around 4 seconds. On average though, I'd say there is around 50 unique terms.

It seems that the query time hovers around 4 and 5 seconds regardless of the query.

The opposite is true I guess? After some runs, whatever the query is it takes less than 1s right?

What kind of hardware do you have?

Yes, but that's because it is cached (Also, it only needs 1 run to take less than 1s). The main problem still persists. We expect each user to have different search conditions, which means caching is irrelevant to our scenario.

I'm not the one who set up the hardware but we use AWS. I'll have to ask our DevOps Engineer for the specs and I'll get back to you as soon as I can.

I meant that whatever the user search for it should be fast after some calls.

Did you try that?

Yes, as expected, the succeeding searches with the exact same conditions will be faster.

However, succeeding searches were not our problem in the first place, since if ES did not have built-in caching, we would have implemented it on an application level. Our problem is the first time a user gets a list of suggestions which is generated the moment he searches for a keyword which, as I described, takes 5 seconds.

Also, to get a better grasp of our problem, we have 6 fields to get suggestions from. Combining these 6 together in one query takes up a total of 15 - 20 seconds with 3 data nodes. We were able to reduce the query time to 6 seconds by converting it into an msearch, which we believe is sped up because of parallel processing.

I believe that the limit of speeding up msearch by increasing data nodes is 4 - 5s, since that's what a single query takes. We are trying to reduce this number since it doesn't make sense, especially with the query with only two results which theoretically shouldn't take much longer that a query without the aggregates (200ms, then some additional 100 or so ms to put the unique terms into a bucket programmatically).

Could you share:

  • A typical document
  • A typical slow response from elasticsearch

Thanks

Hi, I just got a response from our DevOps Engineer. He said our cluster contains two master nodes (AWS c5.large) and three data nodes (1 primary [AWS r4.2xlarge], 2 replica [AWS r4.2xlarge]). He set the index shard count to 10.

Also, I asked our team if I can share a document but they said I can't since it's actual data. I can share the mapping though. Here it is:

{
    "_index": "XXXXX",
    "_type": "XXXXX",
    "_id": "XXXXX",
    "_score": 99999.837894,
    "_source": {
        "Vessel Name": "XXXXX",
        "Mode of Transportation": "XXXXX",
        "Country of Origin": "XXXXX",
        "Conveyance ID": "XXXXX",
        "Manifest Unit": "XXXXX",
        "Voyage Number": "XXXXX",
        "Containers": [
            {
                "Load Status": "XXXXX",
                "Seal Numbers": "XXXXX",
                "Cargoes": {
                    "Piece Count": 99999,
                    "Description": "XXXXX"
                },
                "Container Number": "XXXXX",
                "Width": 99999,
                "Length": 99999,
                "Equipment Description": "XXXXX",
                "Marks": "XXXXX",
                "Height": 99999,
                "Type": "XXXXX",
                "Type of Service": "XXXXX"
            }
        ],
        "Arrival Date": 99999,
        "Port of Destination": "XXXXX",
        "Place of Receipt": "XXXXX",
        "Vessel Country": "XXXXX",
        "Estimated Arrival Date": 99999,
        "Foreign Port of Destination": "XXXXX",
        "Shipper": {
            "Name": "XXXXX",
            "Address": "XXXXX"
        },
        "Foreign Port of Lading": "XXXXX",
        "Manifest Quantity": 99999,
        "Bill of Lading Number": "XXXXX",
        "Second Notity Party": "XXXXX",
        "Carrier": {
            "City": "XXXXX",
            "Code": "XXXXX",
            "Name": "XXXXX",
            "Country": "XXXXX",
            "Zip Code": "XXXXX",
            "State": "XXXXX",
            "Address": "XXXXX"
        },
        "Manifest Number": "XXXXX",
        "Number of Containers": 99999,
        "Bill Type": "XXXXX",
        "In-Bond Entry Type": "XXXXX",
        "Notify Party": {
            "Name": "XXXXX",
            "Address": "XXXXX"
        },
        "Weight": 99999,
        "Measurement Unit": "XXXXX",
        "Consignee": {
            "Cleaned Address Breakdown": {
                "StreetNamePostType": "XXXXX",
                "PlaceName": "XXXXX",
                "StateName": "XXXXX",
                "ZipCode": "XXXXX",
                "CountryName": "XXXXX",
                "AddressNumber": "XXXXX",
                "StreetName": "XXXXX"
            },
            "Cleaned Address": "XXXXX",
            "Name": "XXXXX",
            "Address": "XXXXX"
        },
        "Weight Unit": "XXXXX",
        "Measurement": 99999,
        "Port of Unlading": "XXXXX"
    }
}

For the searches, here is a typical search (together with the results):


Also, here is the query I'm talking about that only gets two results but still takes 5 seconds:


Screenshot%20from%202018-02-08%2008-17-09

Hi David, I discovered something new today. I now have reason to believe that the problem is not with the search itself but on initialization. Every time I clear the cache, any query with terms aggregation take around 5 seconds. However, this only happens once per field. For example, if I take the suggestions for Consignee.Name with keyword apple, it will take 5 seconds. On the second try, however, whatever keyword you use will take less than a second (e.g. I used tide, for Consignee). However, when I take suggestions for the Shipper.Name instead, it goes back to 5 seconds. All subsequent suggestions with Shipper.Name and Consignee.Name takes less than 1 second after making the initial search on both fields.

With this, I think that the problem is somehow initializing the aggregation buckets or something in your implementation that involves loading things into the memory? If that is the case, is there something we can do to do this beforehand without having to search once? If that is not the case, do you have any idea what might be the problem?

This is what I tried to say:

Yes. The first time you call it some OS cache level and ES cache level is happening.
So you can make the first calls yourself when the cluster starts before accepting the first user query.
Or let the unlucky first user wait for 5 seconds

1 Like

Sorry about that, I see what you mean now. I read about fielddata preloading, will this be a good replacement to making the first calls? Since I noticed that the cache clears after some hours.

We are perfectly fine with setting some kind of CRON job to beat the user to the first uncached call but it would be nice if there was a pure ES solution.

By default in recent versions, we don't use fielddata. I can't say in your case as you did not share the mapping.

Doc values is better in terms of memory pressure. It avoids loading tons of data in the HEAP.

There used to have a warmer API but we removed it as it was totally something you can replace better with an external job.

About that, I tried to send it earlier but there is a 7000 character limit.

{
 properties:{
  ActualArrivalDate:{
   type:long
  },
  ArrivalDate:{
   type:long
  },
  BillType:{
   type:text
  },
  BillofLadingNumber:{
   type:text,
   fields:{
    untouched:{
     type:keyword
    }
   }
  },
  Carrier:{
   properties:{
    Address:{
     type:text
    },
    City:{
     type:text
    },
    Code:{
     type:text,
     fields:{
      untouched:{
       type:keyword
      }
     }
    },
    Country:{
     type:text
    },
    Name:{
     type:text,
     fields:{
      untouched:{
       type:keyword
      }
     }
    },
    State:{
     type:text
    },
    ZipCode:{
     type:text
    }
   }
  },
  Consignee:{
   properties:{
    Address:{
     type:text
    },
    CleanedAddress:{
     type:text,
    },
    CleanedAddressBreakdown:{
     properties:{
      AddressNumber:{
       type:text,
      },
      CountryName:{
       type:text,
      },
      PlaceName:{
       type:text,
       fields:{
        untouched:{
         type:keyword
        }
       }
      },
      StateName:{
       type:text,
       fields:{
        untouched:{
         type:keyword
        }
       }
      },
      StreetName:{
       type:text,
      },
      StreetNamePostType:{
       type:text,
      },
      StreetNamePreDirectional:{
       type:text,
      },
      ZipCode:{
       type:text,
       fields:{
        untouched:{
         type:keyword
        }
       }
      }
     }
    },
    Name:{
     type:text,
     fields:{
      untouched:{
       type:keyword
      }
     }
    }
   }
  },
  Containers:{
   properties:{
    Cargoes:{
     properties:{
      Description:{
       type:text,
       fields:{
        untouched:{
         type:keyword
        }
       }
      },
      PieceCount:{
       type:long
      }
     }
    },
    ContainerNumber:{
     type:text
    },
    EquipmentDescription:{
     type:text
    },
    HazardousMaterials:{
     properties:{
      Class:{
       type:text,
      },
      Classification:{
       type:text,
      },
      Code:{
       type:text,
      },
      CodeQualifier:{
       type:text,
      },
      Contact:{
       type:text,
      },
      Description:{
       type:text,
      },
      FlashPointTemperature:{
       type:text,
      },
      PageNumber:{
       type:text,
      }
     }
    },
    Height:{
     type:long
    },
    Length:{
     type:long
    },
    LoadStatus:{
     type:text
    },
    Marks:{
     type:text,
     fields:{
      untouched:{
       type:keyword
      }
     }
    },
    SealNumbers:{
     type:text
    },
    Type:{
     type:text
    },
    TypeOfService:{
     type:text
    },
    TypeofService:{
     type:text,
    },
    Width:{
     type:long
    }
   }
  },
  ConveyanceID:{
   type:text
  },
  CountryofOrigin:{
   type:text,
   fields:{
    untouched:{
     type:keyword
    }
   }
  },
  EstimatedArrivalDate:{
   type:long
  },
  ForeignPortofDestination:{
   type:text,
   fields:{
    untouched:{
     type:keyword
    }
   }
  },
  ForeignPortofLading:{
   type:text,
   fields:{
    untouched:{
     type:keyword
    }
   }
  },
  In-BondEntryType:{
   type:text,
   fields:{
    untouched:{
     type:keyword
    }
   }
  },
  ManifestNumber:{
   type:text
  },
  ManifestQuantity:{
   type:long
  },
  ManifestUnit:{
   type:text
  },
  MasterBillofLadingNumber:{
   type:text,
   fields:{
    untouched:{
     type:keyword
    }
   }
  },
  Measurement:{
   type:long
  },
  MeasurementUnit:{
   type:text
  },
  ModeofTransportation:{
   type:text
  },
  NotifyParty:{
   properties:{
    Address:{
     type:text
    },
    CleanedAddress:{
     type:text,
    },
    CleanedAddressBreakdown:{
     properties:{
      AddressNumber:{
       type:text,
      },
      CountryName:{
       type:text,
      },
      PlaceName:{
       type:text,
       fields:{
        untouched:{
         type:keyword
        }
       }
      },
      StateName:{
       type:text,
       fields:{
        untouched:{
         type:keyword
        }
       }
      },
      StreetName:{
       type:text,
      },
      StreetNamePostType:{
       type:text,
      },
      StreetNamePreDirectional:{
       type:text,
      },
      ZipCode:{
       type:text,
       fields:{
        untouched:{
         type:keyword
        }
       }
      }
     }
    },
    Name:{
     type:text,
     fields:{
      untouched:{
       type:keyword
      }
     }
    }
   }
  },
  NumberofContainers:{
   type:long
  },
  PlaceofReceipt:{
   type:text
  },
  PortofDestination:{
   type:text,
   fields:{
    untouched:{
     type:keyword
    }
   }
  },
  PortofUnlading:{
   type:text,
   fields:{
    untouched:{
     type:keyword
    }
   }
  },
  RunDate:{
   type:long
  },
  SecondNotityParty:{
   type:text
  },
  Shipper:{
   properties:{
    Address:{
     type:text
    },
    Name:{
     type:text,
     fields:{
      untouched:{
       type:keyword
      }
     }
    }
   }
  },
  TradeUpdateDate:{
   type:long
  },
  VesselCountry:{
   type:text
  },
  VesselName:{
   type:text
  },
  VoyageNumber:{
   type:text
  },
  Weight:{
   type:long
  },
  WeightUnit:{
   type:text
  }
 }
}

Here is the mapping, I removed the double quotes so it can fit the 7000 character limit but I suppose that is unimportant.

You can share it a a gist (gist.github.com)