Span#setLabel(String, Number) doesn't work

APM Agent language and version: java and apm agent library = 1.20.0

Original install method (e.g. download page, yum, deb, from source, etc.) and version: gradle

Description of the problem including expected versus actual behavior. Please include screenshots (if relevant):

Steps to reproduce:

  1. capture or create new span and set label with number value
  2. go to elastic and take a look at index
  3. the label is not set in index and data is not passed in logs

I tried different ways to set label into transaction or span - to get current transaction or current span, create new transaction or span, added annotations like @CaptureSpan or @CaptureTransaction but it doesn't work, I don't see that the label is set.

I checked your code in github and noticed one thing, I'm not sure how this whole instrumentation thing works, but would like to ask about it if it does matter or not:

Method AbstractSpanImpl#doAddNumberLabel has AddNumberTagInstrumentation inner class value in comments, but AbstractSpanInstrumentation class contains only AddNumberLabelInstrumentation which is different in name.

Hi @dmitry_first ,

Here it's the doAddNumberLabel method name that matters, this comment has been made obsolete when we deprecated the doAddTag method. What tends to be confusing here is that API is a no-op implementation and agent injects the whole implementation at runtime.

Thanks for noticing this inconsistency, I've fixed it on master.

However, you should normally be able to use the API to set custom labels, especially if you already have captured spans & transactions. Please note that those labels are not visible in APM UI, you will have to browse the documents in the index to find them.

Few things to check:

  • When you call ElasticApm.currentTransaction() do you have a non-null return value ?
  • Does it works when you set a String or a Boolean label instead of a Number ?

Hi @Sylvain_Juge, thank you for reply.
About questions:

  • When you call ElasticApm.currentTransaction() do you have a non-null return value ? - yes, it is non-null, created transaction.
  • Does it works when you set a String or a Boolean label instead of a Number ? - no, I cannot find any labels:

Here is an example of code where I test it:

import lombok.extern.slf4j.Slf4j;
import net.logstash.logback.marker.Markers;
import org.springframework.web.bind.annotation.GetMapping;
import org.springframework.web.bind.annotation.RequestMapping;
import org.springframework.web.bind.annotation.RestController;

@Slf4j
@RestController
@RequestMapping("/rest/v1")
public class TestController {

    @CaptureTransaction
    @CaptureSpan
    @GetMapping("test")
    public void testEndpoint() {
        Transaction t = ElasticApm.currentTransaction();
        t.setLabel("test_number_1", 1);
        t.setLabel("test_string_1", "test value");
        t.setLabel("test_boolean_1", true);
        log.info(Markers.append("test_marker_1", 1), "testing log");
    }
}

I see this in logs of the application:
2021-02-05T14:19:50.825+01:00 [APP/PROC/WEB/0] [OUT] {"@timestamp":"2021-02-05T13:19:50.824Z", "log.level": "INFO", "message":"testing log", "service.name":"madl-ordermanager","process.thread.name":"http-nio-8080-exec-1","log.logger":"com.corelogic.gateway.ordermanager.rest.v1.TestController","transaction.id":"8348a855b458358d","trace.id":"2f8b12bab676151032d68dde7b34cf76"}

Screenshot of debugging after setting of label:

I should notice that traceContext.flags = 0 and it looks like it doesn't allow to set labels:

I debugged it and it goes to apm-agent-java/AbstractSpan.java at 64fbb2653807975796f99511ea4cd9efb6a5e20b · elastic/apm-agent-java · GitHub
and AbstractSpan#isSampled method returns false.
Maybe you have any thoughts on this?
How can I make it setting these labels?

First, for your transaction as it seems to be a Spring MVC application, you don't need to have those two annotations. Once you have removed them you should still have a non-null transaction.

Then, if the transaction is not marked as sampled, it means that we only capture high-level metrics on it, and we don't collect the full trace. Did you changed the default configuration ? For example the sample_rate to a value less than 1.0 ?

When using the APM API, it does adds labels to the traces that are stored in the apm-*-transaction-* index (for transactions), I don't know if those are also propagated to log index automatically.
In your case, could you search for documents that have "transaction.id":"8348a855b458358d" ?

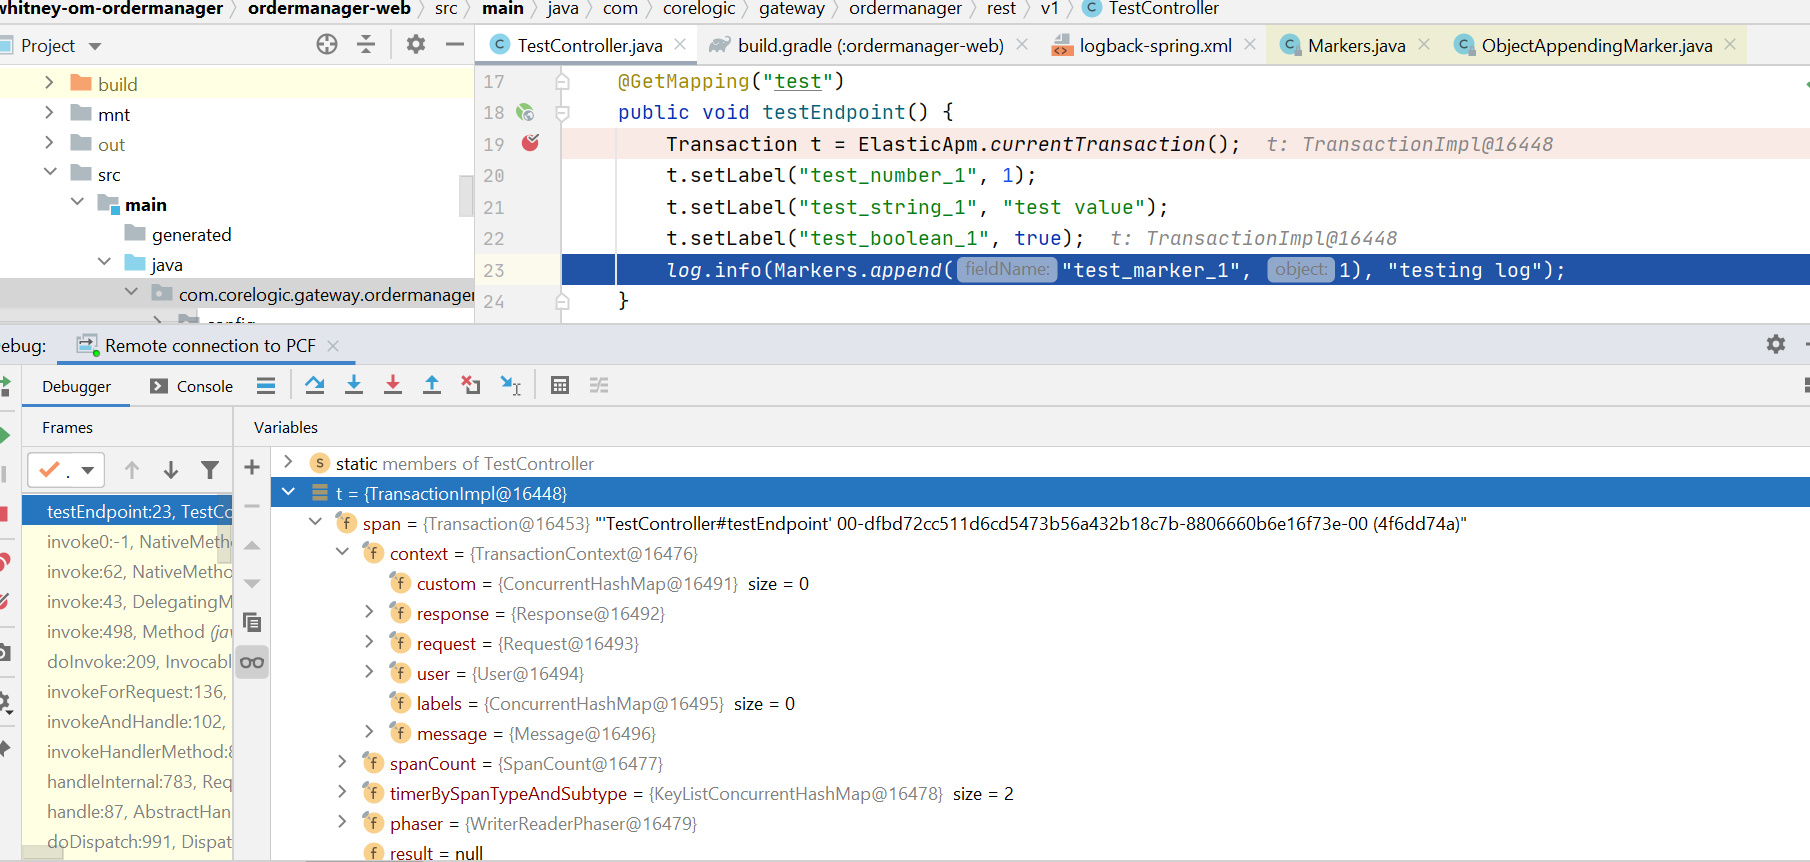
About sample_rate, we have decreased value = 0.02 because there were problems with ingestion of events and a team who is responsible for ELK recommended to do it.
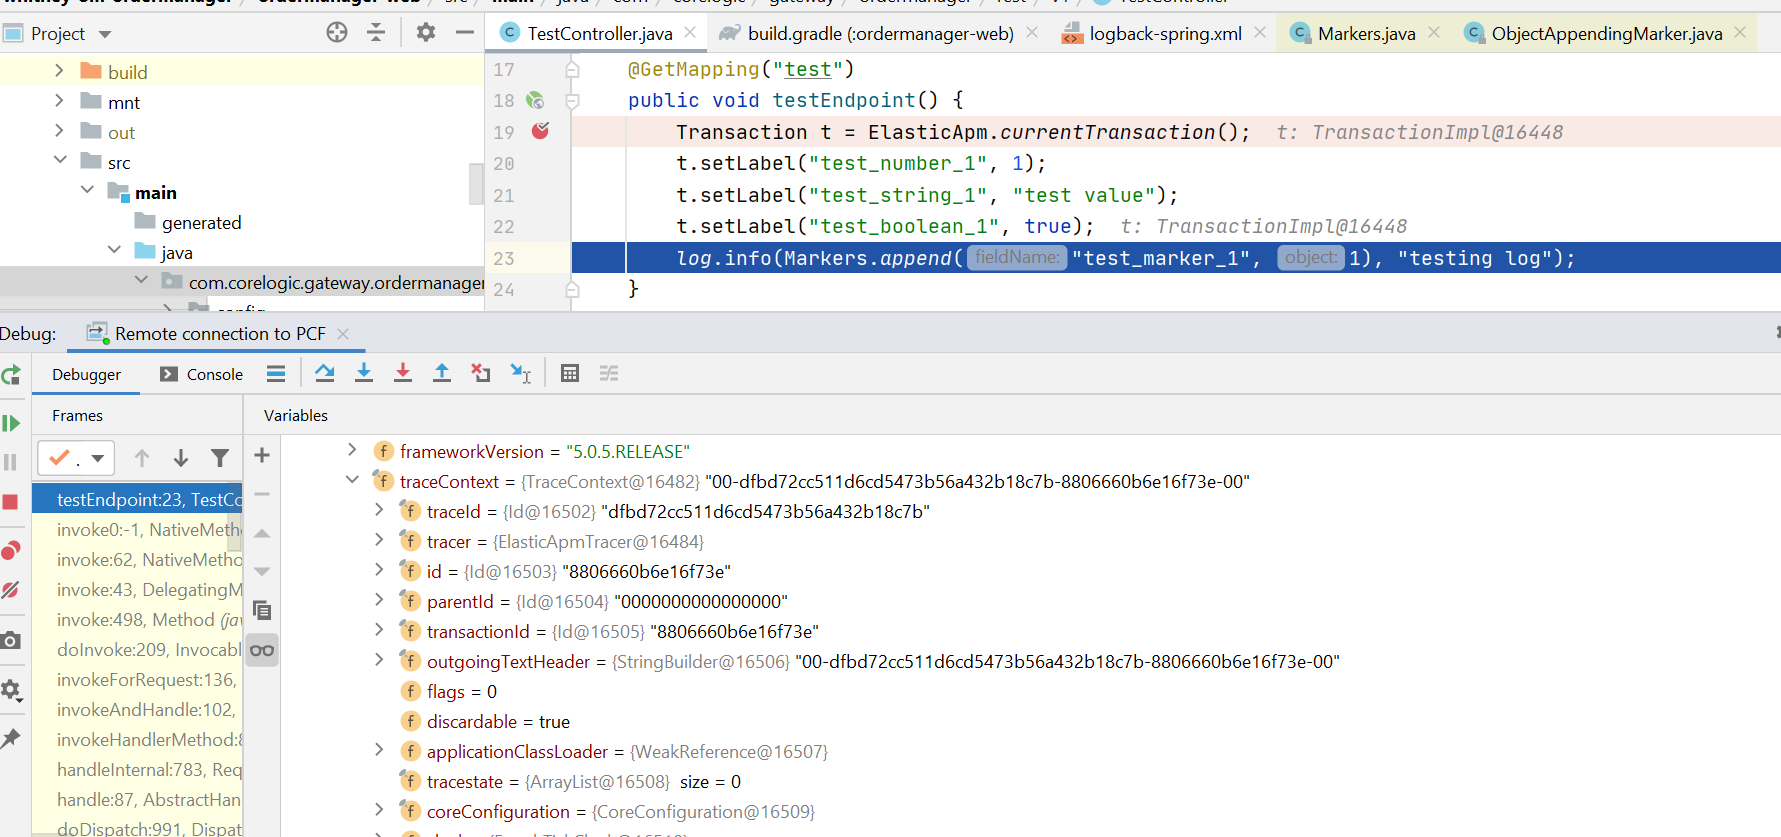
We have apm-* index and I haven't found any labels with the same names.
The document for "transaction.id":"8348a855b458358d":

{
  "_index": "logs-data_portals_us-000401",
  "_type": "_doc",
  "_id": "w7hZcncBjKsXx9WOTca5",
  "_version": 1,
  "_score": null,
  "_source": {
    "@timestamp": "2021-02-05T13:19:50.824Z",
    "clgx_pcf_app": "ordermanager",
    "port": 59798,
    "syslog5424_msg": "{\"@timestamp\":\"2021-02-05T13:19:50.824Z\", \"log.level\": \"INFO\", \"message\":\"testing log\", \"service.name\":\"madl-ordermanager\",\"process.thread.name\":\"http-nio-8080-exec-1\",\"log.logger\":\"com.corelogic.gateway.ordermanager.rest.v1.TestController\",\"transaction.id\":\"8348a855b458358d\",\"trace.id\":\"2f8b12bab676151032d68dde7b34cf76\"}",
    "log.level": "INFO",
    "objectid": "tags@47450",
    "log.logger": "com.corelogic.gateway.ordermanager.rest.v1.TestController",
    "transaction.id": "8348a855b458358d",
    "syslog_facility_code": 1,
    "message": "testing log",
    "process.thread.name": "http-nio-8080-exec-1",
    "syslog_facility": "user-level",
    "syslog5424_proc": "[APP/PROC/WEB/0]",
    "clgx_pcf_space": "whitney",
    "syslog_severity": "notice",
    "@version": "1",
    "type": "syslog",
    "syslog_severity_code": 5,
    "syslog5424_ver": "1",
    "organization": {
      "name": "data_portals_us"
    },
    "service.name": "madl-ordermanager",
    "host": {
      "name": "10.46.20.85"
    },
    "syslog5424_pri": "14",
    "index": "logs-data_portals_us",
    "labels": {
      "application": "ordermanager",
      "environment": "np",
      "space": [
        "whitney",
        "data_portals_us"
      ],
      "organization": "data_portals_us"
    },
    "trace.id": "2f8b12bab676151032d68dde7b34cf76",
    "syslog5424_app": "31a7e8a9-7a81-4143-8daf-3af6b467c248"
  },
  "fields": {
    "IP": [
      "10.46.20.85"
    ],
    "App_id": [
      "31a7e8a9-7a81-4143-8daf-3af6b467c248"
    ],
    "suricata.eve.timestamp": [
      "2021-02-05T13:19:50.824Z"
    ],
    "Host": [
      "dataportalsus-dev.whitney.ordermanager"
    ],
    "@timestamp": [
      "2021-02-05T13:19:50.824Z"
    ],
    "App_name": [
      "ordermanager"
    ],
    "Instance_id": [
      "0"
    ]
  },
  "highlight": {
    "transaction.id": [
      "@kibana-highlighted-field@8348a855b458358d@/kibana-highlighted-field@"
    ]
  },
  "sort": [
    1612531190824
  ]
}

About this thing when sample rate is less than 1, can we explicitly mark in java code that we should take this transaction with all details like labels?

No, there is no way to change that through Java code currently.

With 0.02 it means that you will get traces for 2% of your requests, which can be low depending on your usual transaction rate. With your local setup you should use 1.0 instead and check again.

We already had discussions about this in the past, and one of the issues is that it's hard to do that with distributed tracing, as we need to keep the sampled traces consistent across all services.

Thank you very much for you time, got it.
Another question if you allow - maybe you know is there any opportunity relating to discussed case to add custom field in logging if I have the option to use sample_rate = 1?
We use co.elastic.logging.logback.EcsEncoder and I don't see here how to add entry in json log for elastic instead of discussed label, for example, to add dynamically in log: "labels.custom_field": 1
but it is numeric value, I used MDC previously and it allows only string values.

Hi @dmitry_first ,

You should be able to do that by using two things:

  • mapping this custom field explicitly as a number in Elasticsearch
  • adding a custom field through MDC or using structured logging (log4j2)

As a result, this custom field string value will be automatically coerced into a number.

Hi @Sylvain_Juge, appreciate your help, thanks.

This topic was automatically closed 20 days after the last reply. New replies are no longer allowed.