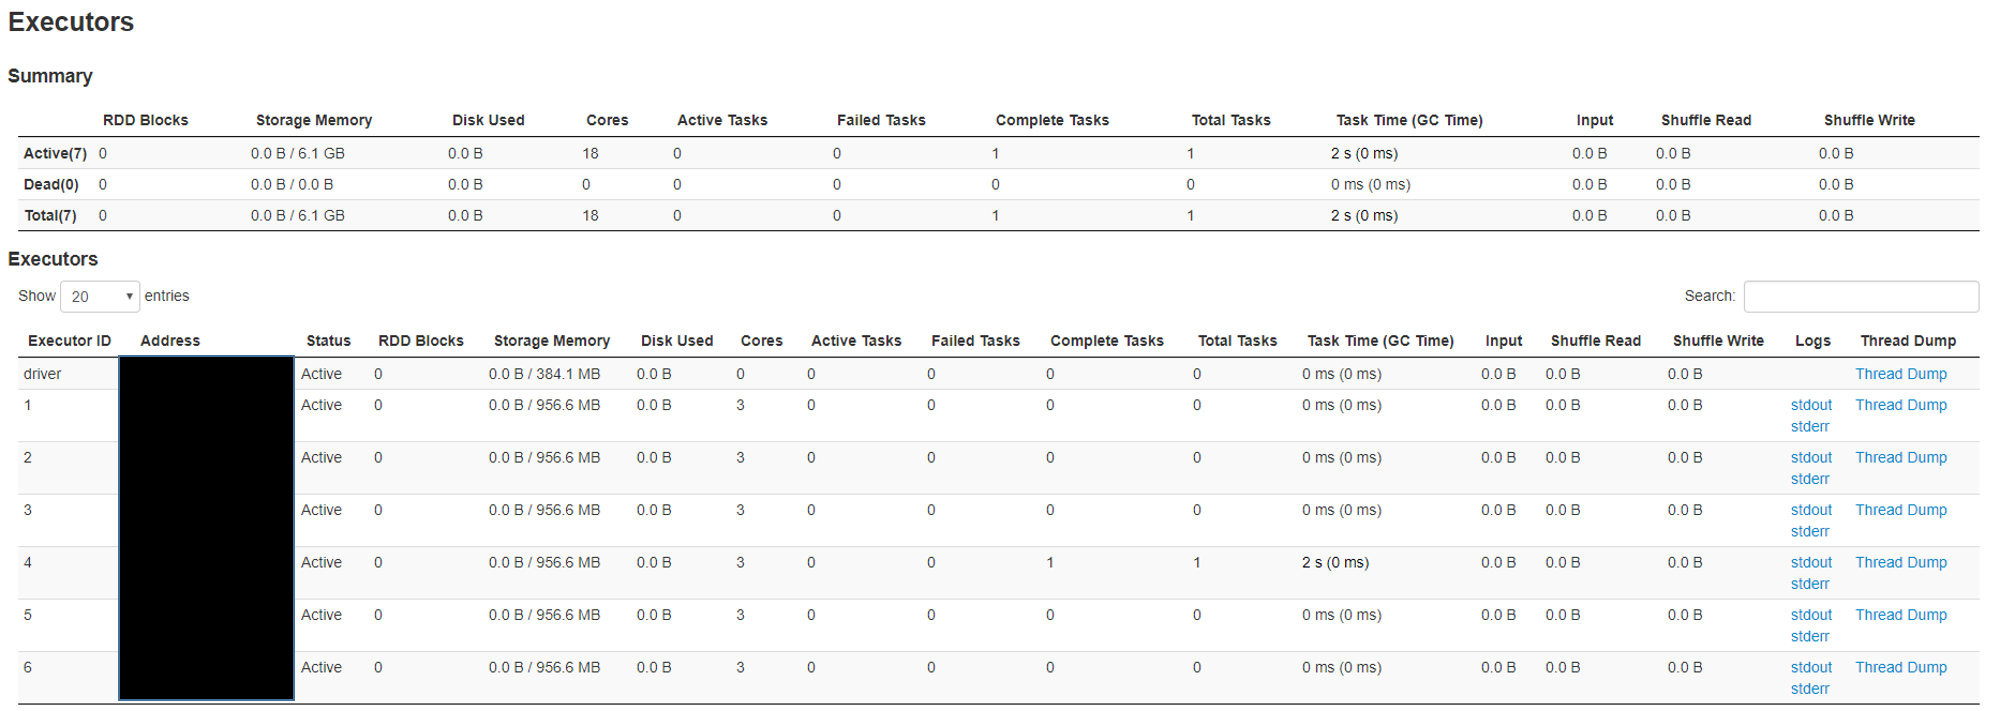
I am currently experiencing performance issues where I notice that the Elasticsearch Spark connector is stuck 10's of minutes warming / starting up without any tasks / jobs allocated. See screen shot. Any idea on what is causing the 10's of minutes of warm up / startup time?
@tranan - that's really peculiar. Are you able to get on to the Spark executor and collect a thread dump from the process using something like jstack and see what the process is stuck doing?
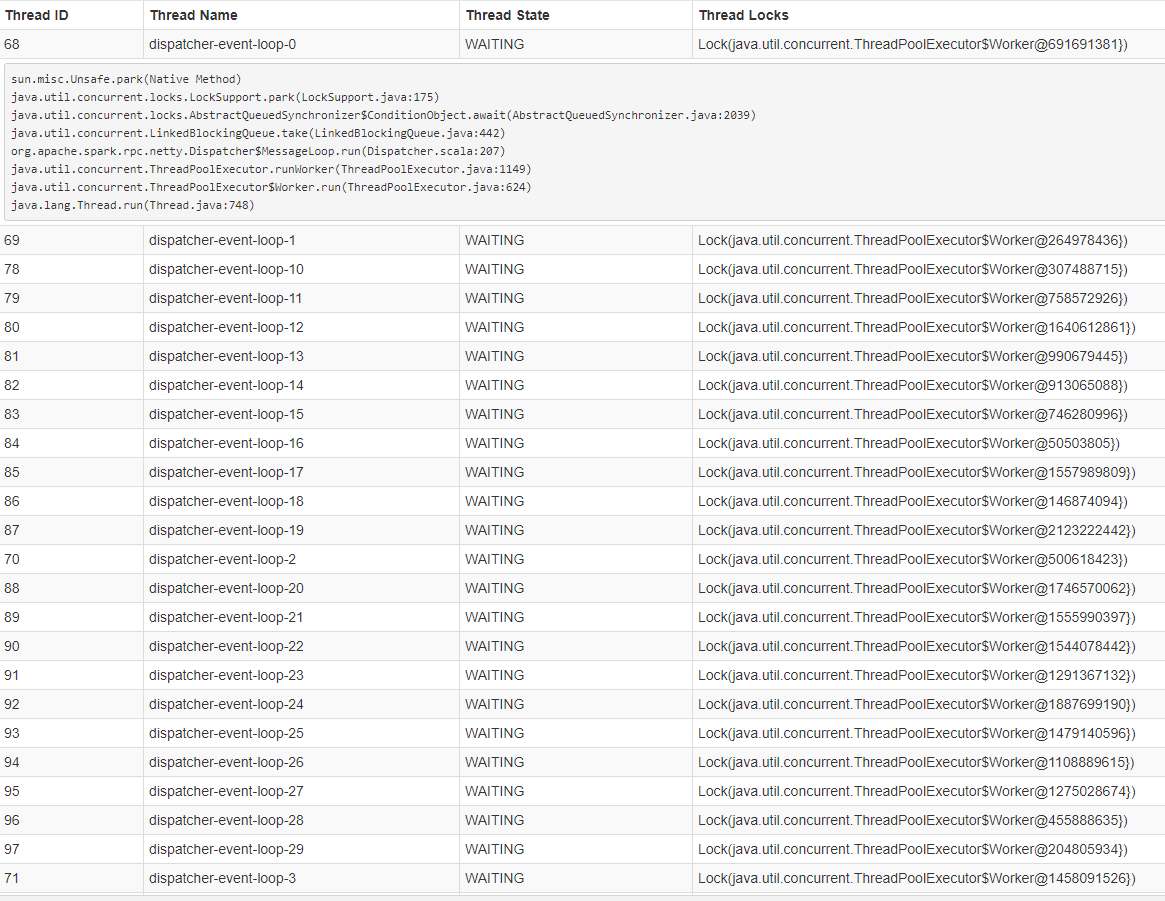
Secondly I have clicked the thread dump link on one of the live executor and see the thread dump screenshot below. This is similar for all the live executors
Please note this is running on YARN. I have also reproduce this issue on another cluster running Spark Standalone pointing to the same Elasticsearch cluster. Also i want to note that the the regular REST and Java API works perfectly.
It seems the cluster is totally idle, waiting for work to be assigned. Would you be able to pull a thread dump from your Spark driver to see what it might be stuck doing that is keeping it from assigning work?
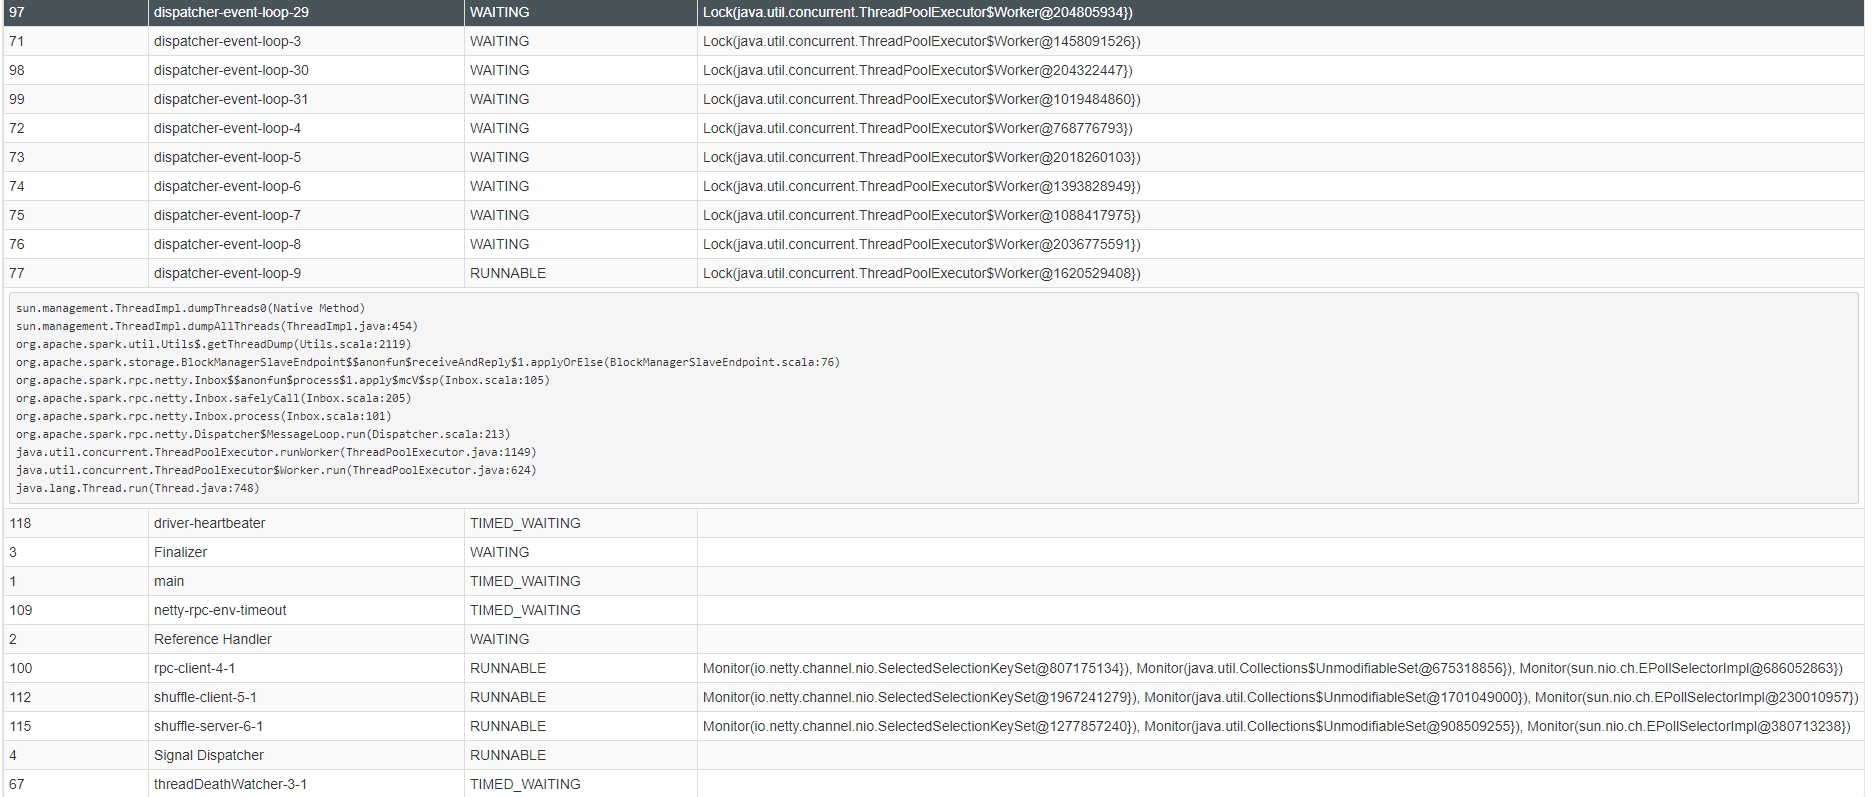
Below is the thread dump of the driver... I suspect the cluster is trying to get a file handle on all the shards that are in the cluster and blocking until it can. There's a total of ~3300 shards in the cluster ~ 30TB of data. I also noticed if i change the http timeout duration say to < 1M i get timeout exception.
I'm not sure I see any ES-Hadoop related classes in those thread dumps. ES-Hadoop does create at least one Spark partition for each shard in the indices that it wants to read from. It's possible that Spark is having a hard time handling that many partitions during its startup phase.
Apache, Apache Lucene, Apache Hadoop, Hadoop, HDFS and the yellow elephant
logo are trademarks of the
Apache Software Foundation
in the United States and/or other countries.