Hi i am working on a stacked bar graph,
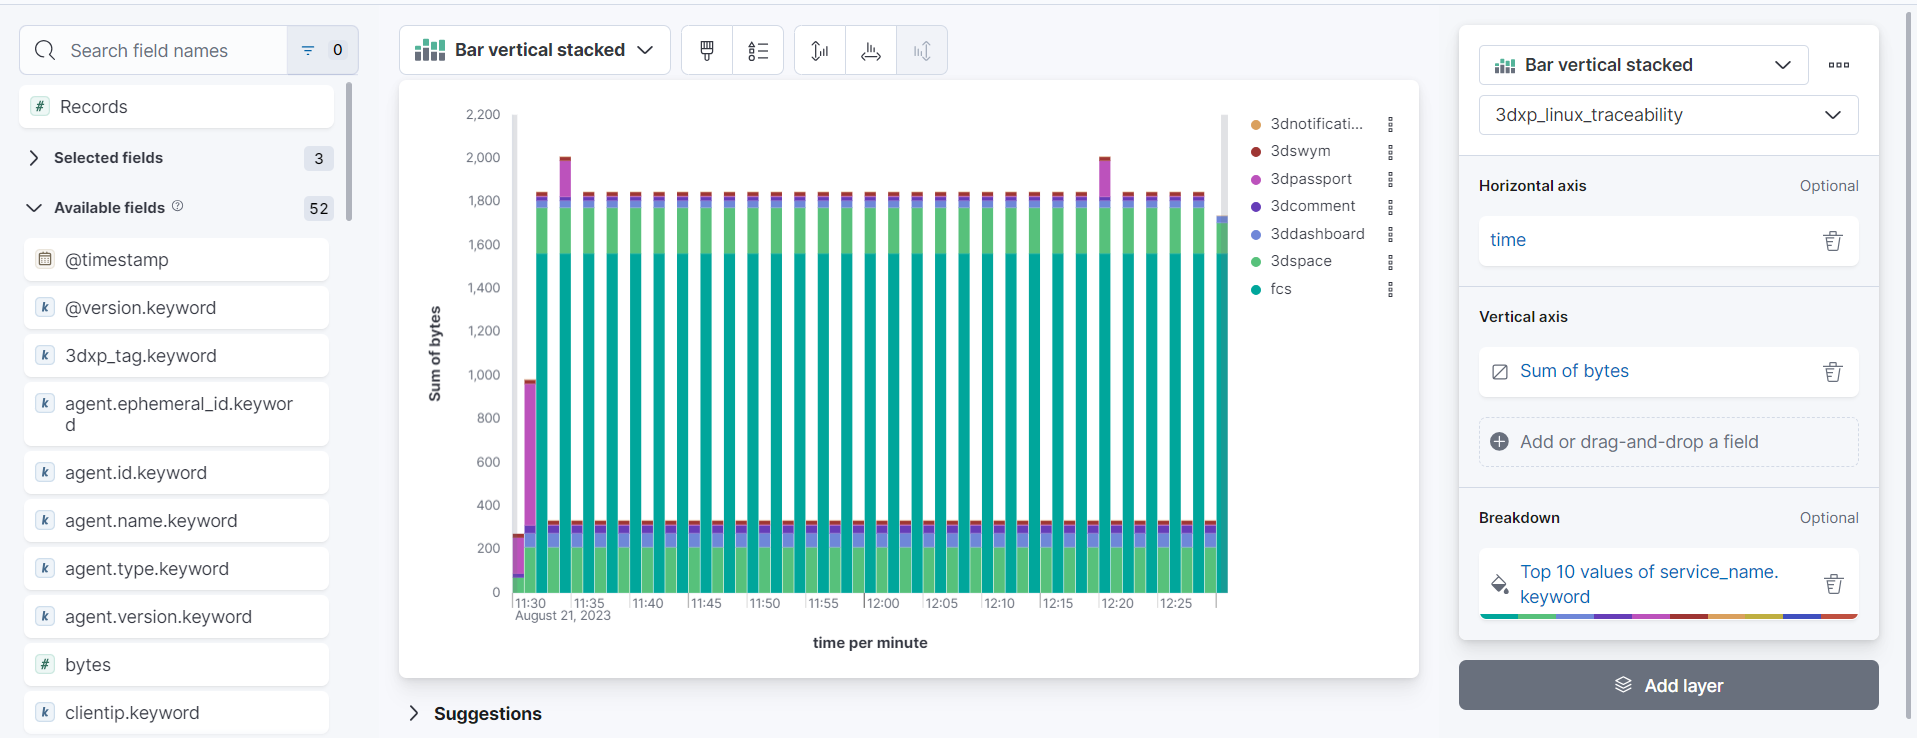
As shown in the image, on x axis i have time on y i have sum of bytes and breakdown by service name. so basically in logs in every entry there is a service name, bytes and time and duration. Is it possible to add the sum of duration and sum of bytes for a service in a single bar?
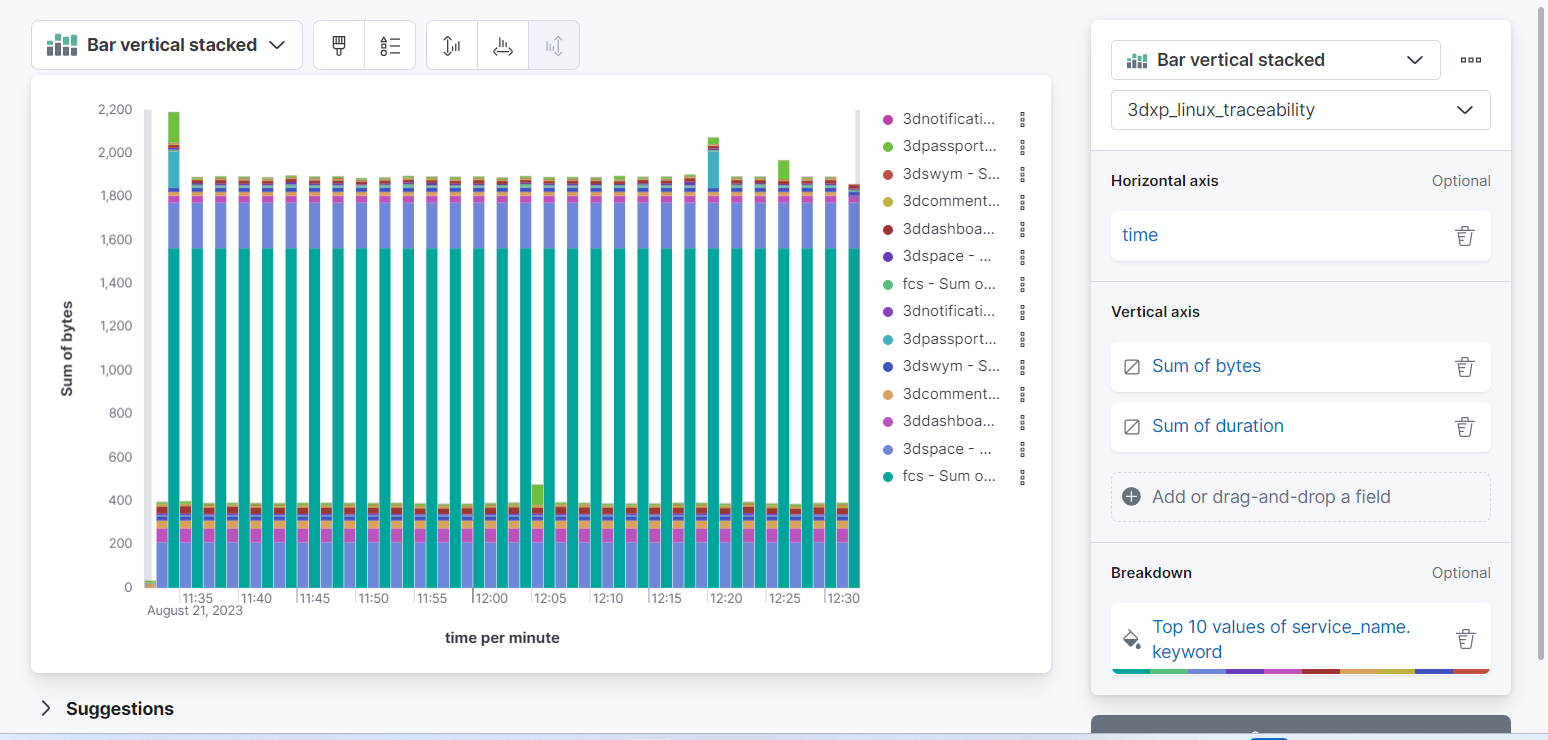
as shown in the image after i add sum of duration as separate field on y axis it is creating multiple entry for every service
e.g. 3dpassport-sum of bytes
3dpassport-sum of duration.
Is there anyway to display 3dpassport: 4B 4ms?
something n this way
Hi @Neelam_Zanvar
not sure I follow what you are looking for.
Maybe you want to divide the sum of bytes by the sum of duration (ie. in Lens formula: sum(bytes) / sum(duration))? Or something else?
no i dont want to divide it. i want the sum of bytes and sum of duration both separately to be seen on every bar
something like dis
sum of bytes and sum of duration for that service at that minute
No, that is not possible in Lens.
Would a table work better for this type of visualization? You could color encode each sum of bytes cell there and show alongside the sum of duration as well.
No, looking for a graphical visualization like this. is it not possible to add a formula in the graph which concatenates sum(bytes) and sum(duration)
No, that is not just a formula, rather a different encoding for one of the dimension (sum of duration) as label only, while the other one (sum of bytes) has to be rendered as stacked bar + label.
sorry, but I didn't get you! How can I do that?
It is not possible. Just explaining that why formula would not work.
ok, is there any visualization other than table? i want a graphical visualization. for every minute i want to see the sum of bytes transferred and duration for each service
annotation is somewhat doing it. but i am not able to access all entries. nor sort them in descending order
Other than having a side by side charts on a dashboard (which syncs the cursors position on hover) something like this is what I had in mind:
This ensure the time sorting order and the breakdown by Top values
okay will give it a try. Thanks!