I am trying to collect System logs from Windows Servers with Standalone Elastic Agent. While necessary System logs are being correctly picked up and indexed into Elasticsearch with Winlogbeat, Elastic Agent causes some issues.
Running agent from: elastic-agent-9.1.3-windows-x86_64
Basic content of elastic-agent.yml file:
I can see that it picks System data and index named logs-system.system-default appears in Elastic but without a single document. When checking elastic-agent-event-log there are errors containing the following message:
{"type":"document_parsing_exception","reason":"\[1:539\] Cannot write to a field alias \[host.hostname\]."}, dropping event!","component":{"binary":"filebeat","dataset":"elastic_agent.filebeat","id":"winlog-default","type":"winlog"},"log":{"source":"winlog-default"},"ecs.version":"1.6.0","log.logger":"elasticsearch.elasticsearch","log.origin":{"file.line":535,"file.name":"elasticsearch/client.go"
and all event data goes under "raw_index". How to solve the issue? Am I missing something in elastic-agent.yml configuration?
I'm cannot determine if it's a misconfiguration on my end or a deeper issue. I've already reviewed the documentation and scanned through several issues, but haven't found a clear solution yet.
If someone from the team could help clarify or guide me in the right direction, I’d really appreciate it!
Cannot write to a field alias \[host.hostname\]."}, This is the issue all the docs are being dropped.
Have you created your own template or edited the default one because host.hostname should not be set as an alias type? AFAIK. So when host.hostname comes in as a field and the type for that field is alias then the document mapping will have a collision and the document will fail to be written.
Needing to be precise, is that an Index or a Data Stream...
Can you get the mapping for that index should be something like and share that specifically the mapping for host.hostname
GET .ds-logs-system.system-default-2025.09.07-000341
And I am confused you said there was no data or is this a different problem... lets fix one thing at a time
I haven’t created my own template or edited any existing ones.
The logs-system.system-default index appeared in Elasticsearch after I ran the Elastic Agent, but it doesn't contain any documents. There is no data stream associated with logs-system.system-default
Regarding the raw_index error logged by Elastic Agent - appears in the file: elastic-agent/data/elastic-agent-*/logs/events/elastic-agent-event-log-*.ndjson.
These logs show that the data is picked up successfully, but fails during indexing due to: "Cannot write to a field alias [host.hostname]"
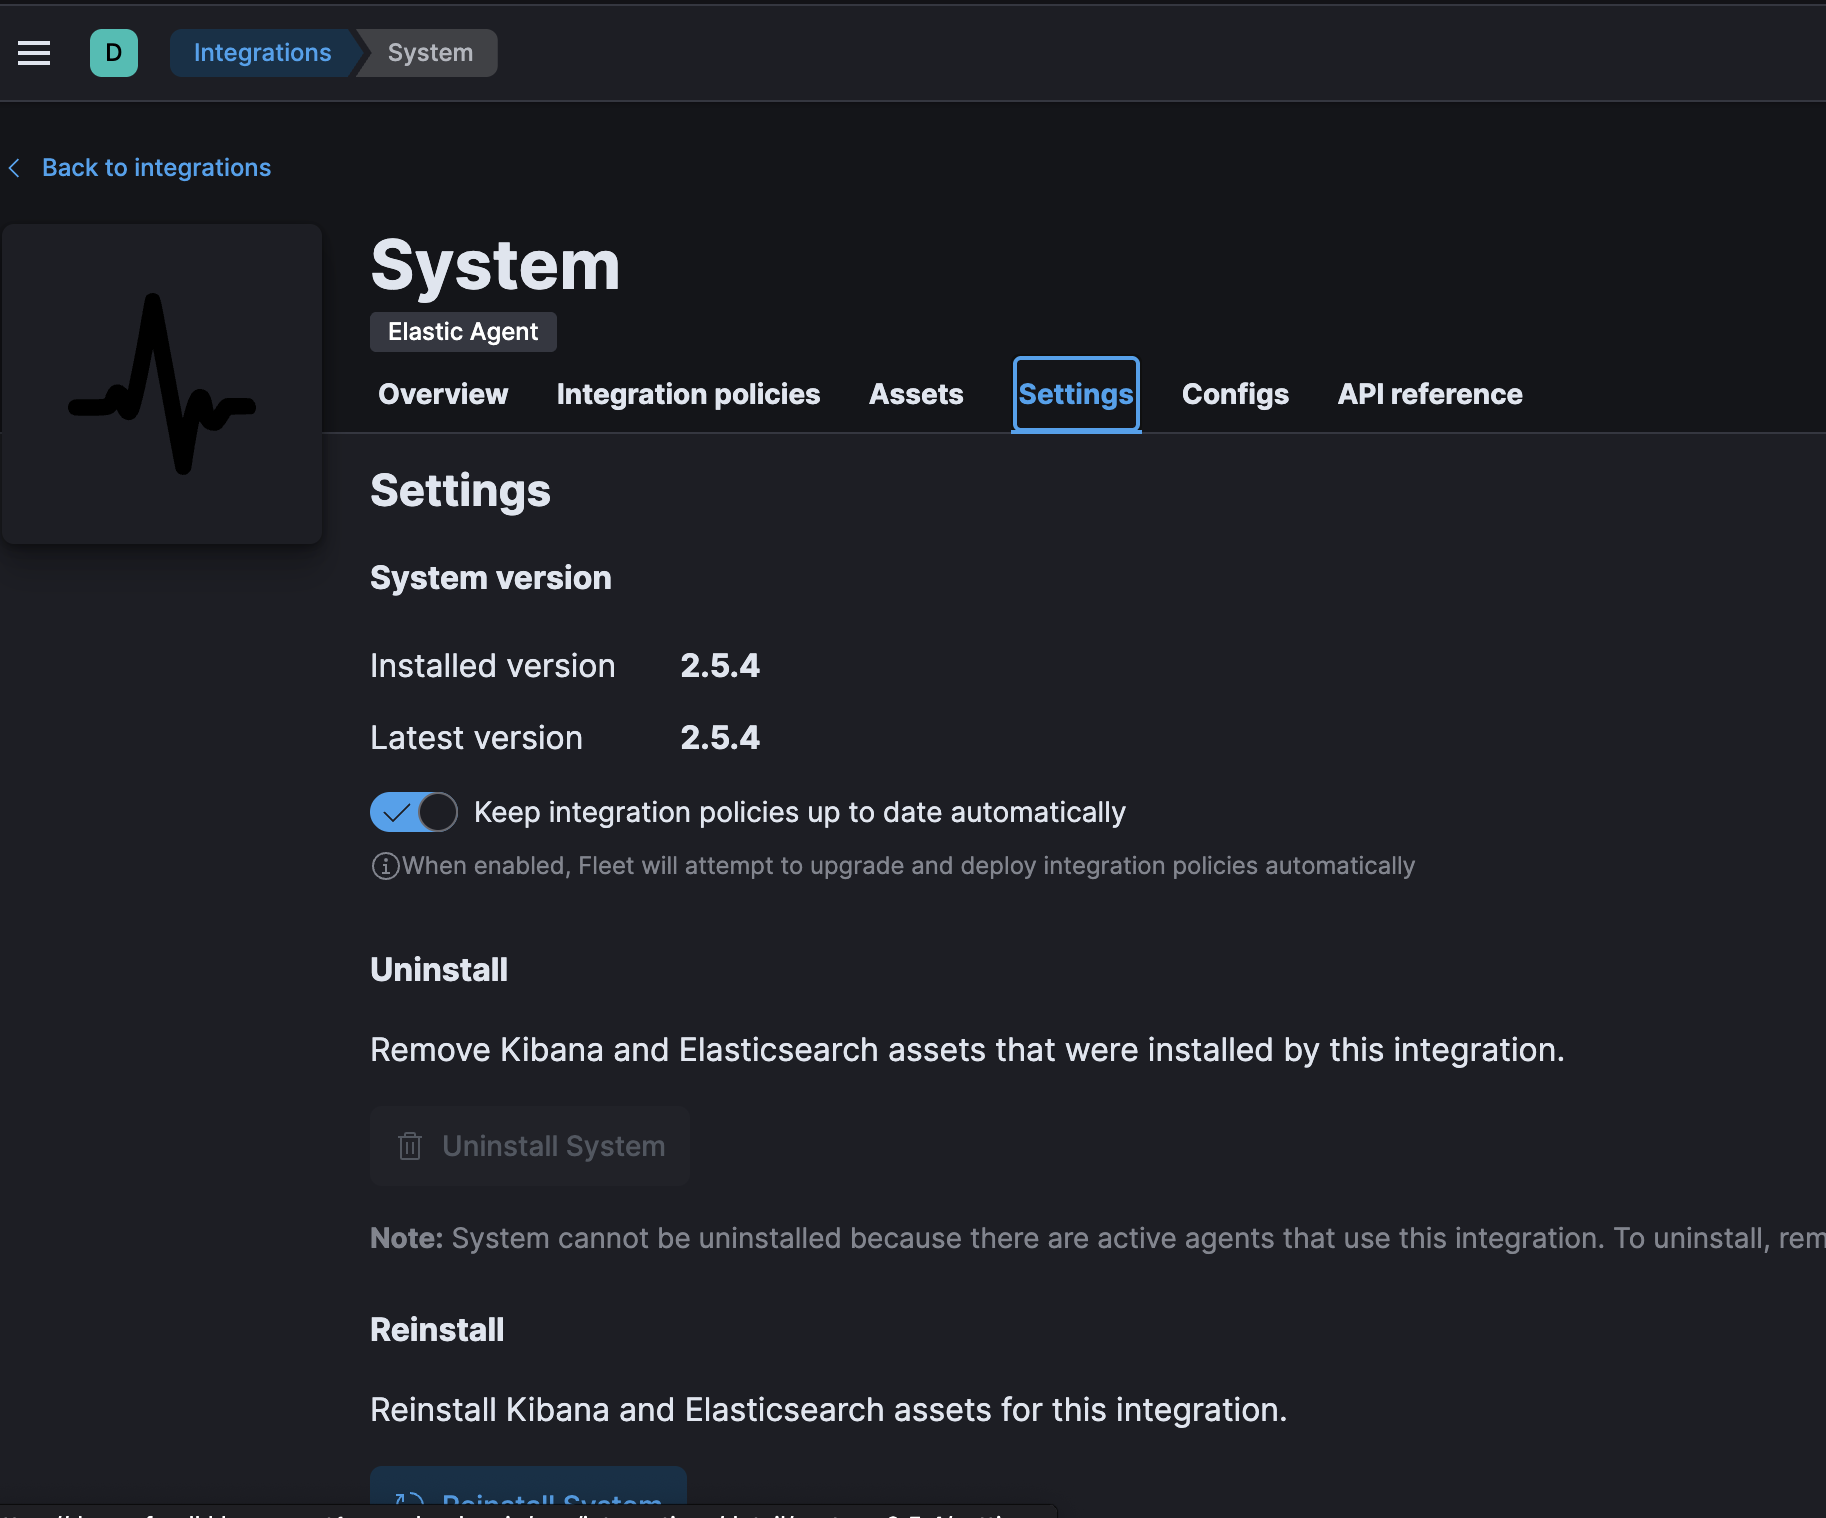
Ohh super important and did you actually add the System Integration in Kibana?
Otherwise the mapping / parsing etc.. Ingest PIpeline will not work!
You have to actually install it
The output indentation in the configuration is correct - I believe it was lost here during formatting.
Thanks a lot for the rest of the information. I'll double check everything tomorrow.
Apache, Apache Lucene, Apache Hadoop, Hadoop, HDFS and the yellow elephant
logo are trademarks of the
Apache Software Foundation
in the United States and/or other countries.